-
Products
-
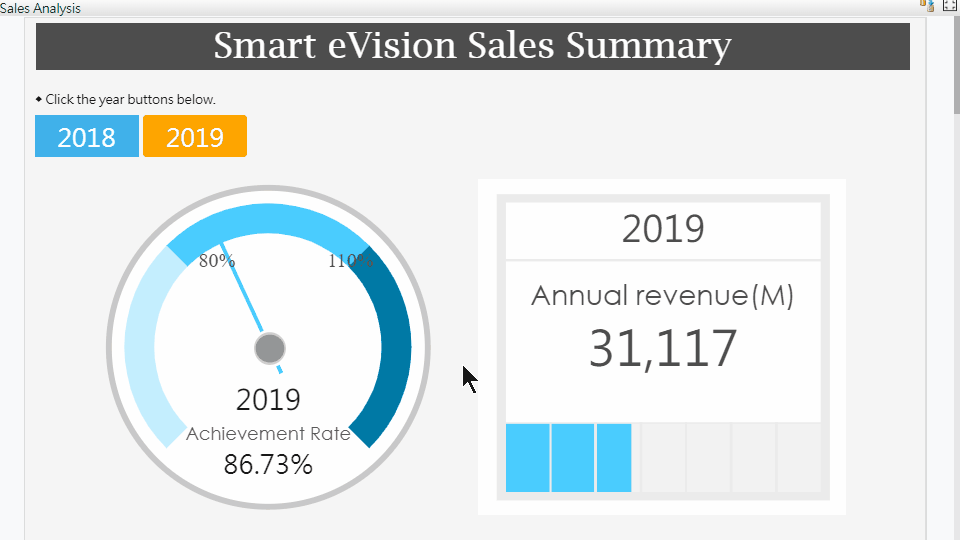
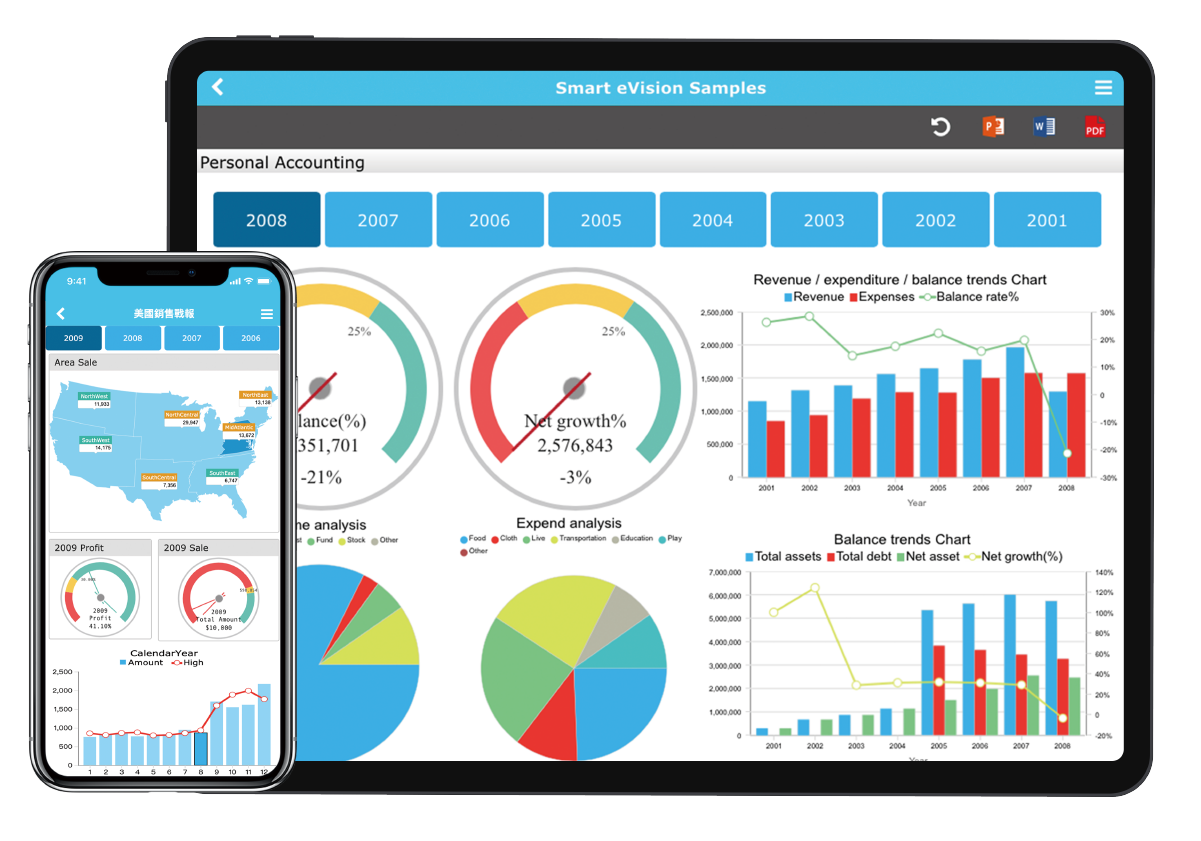
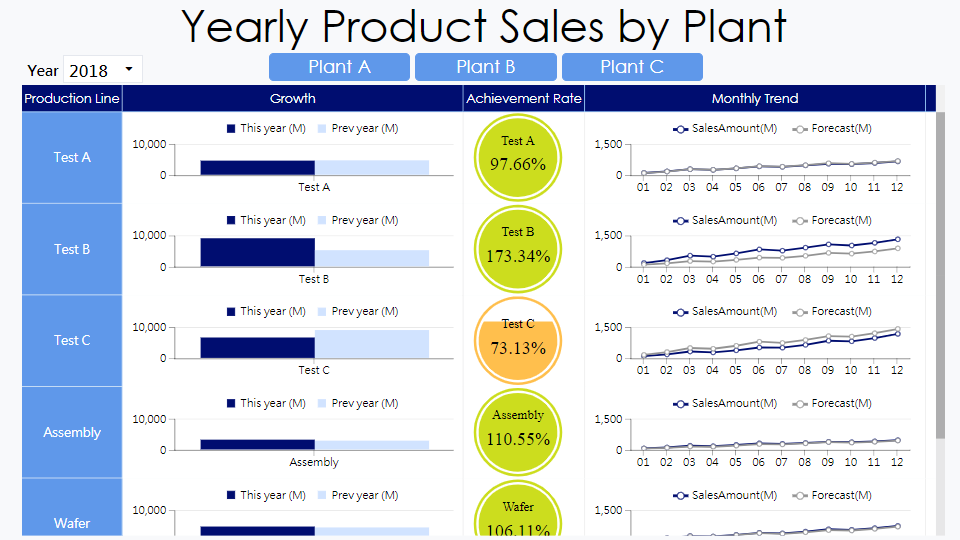
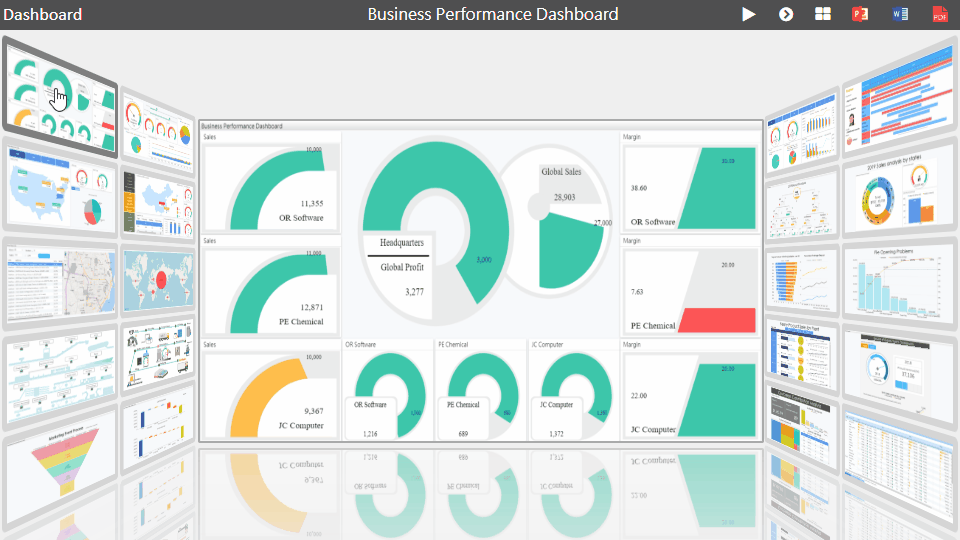
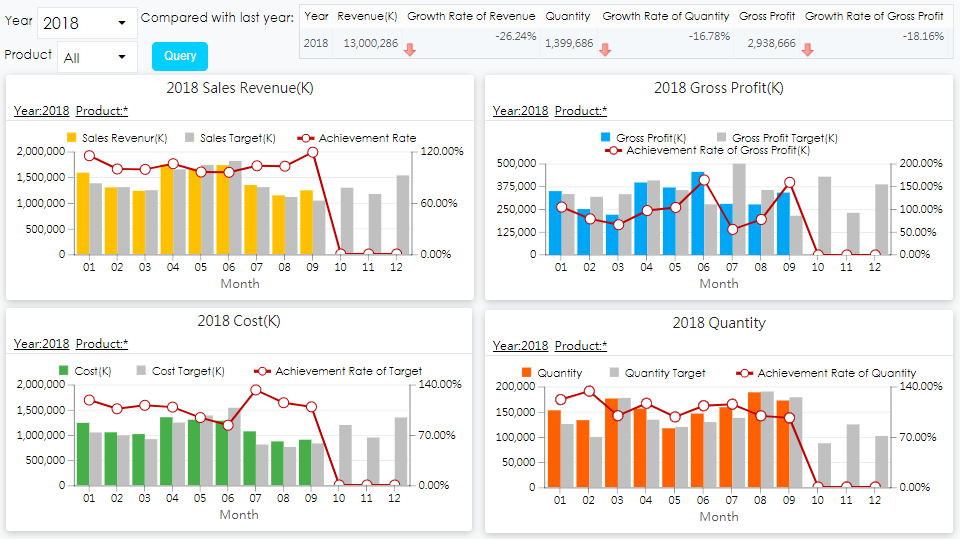
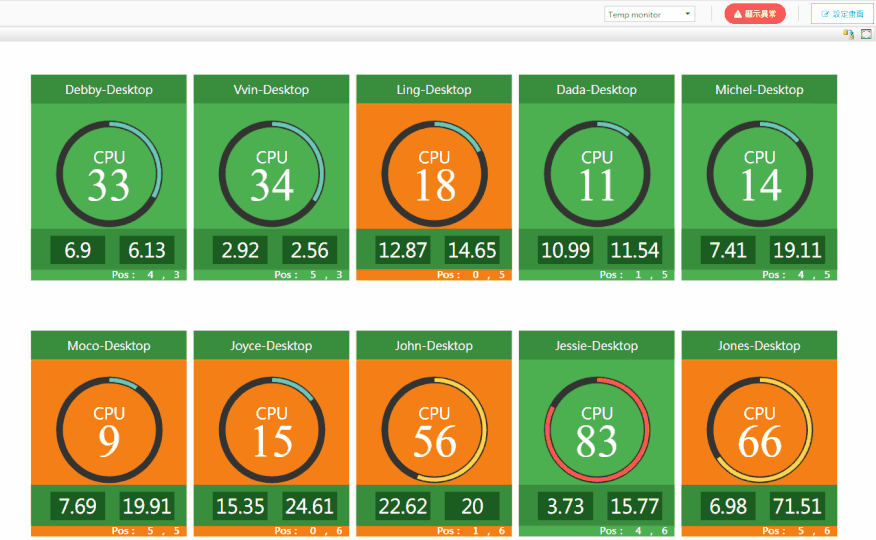
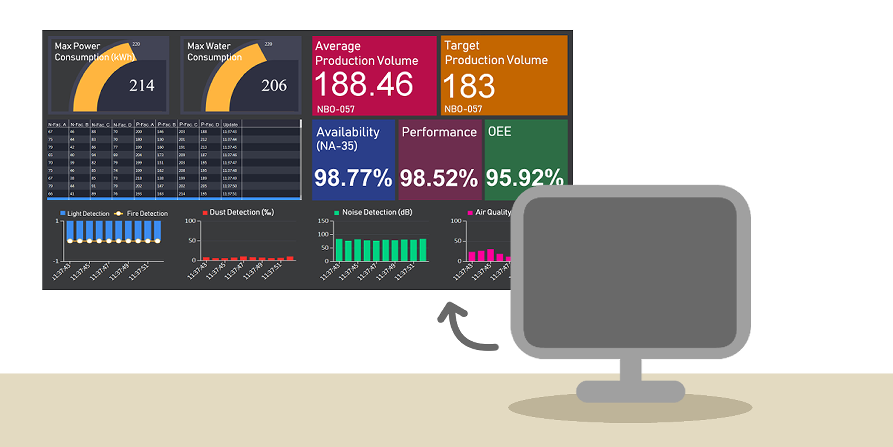
Dashboard
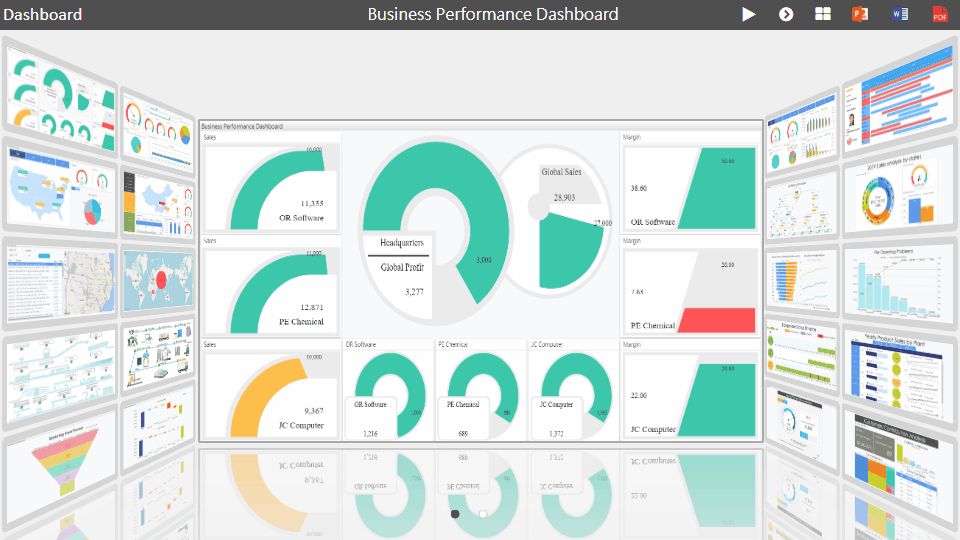
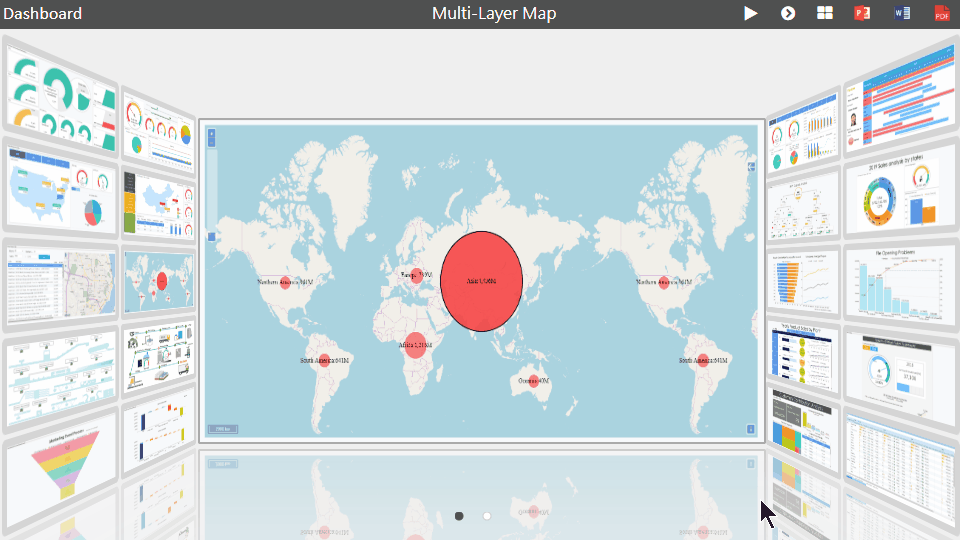
Visualize your data to inspire business insights.
-
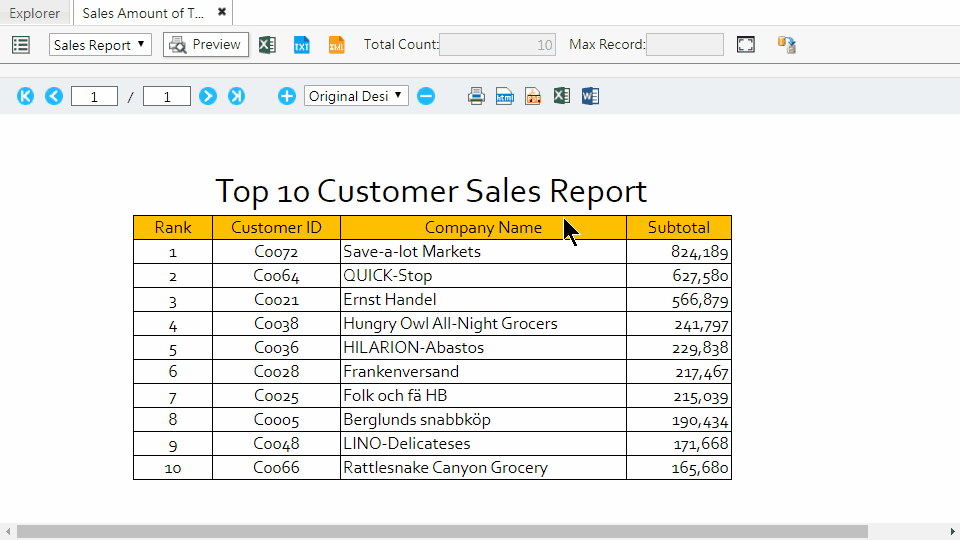
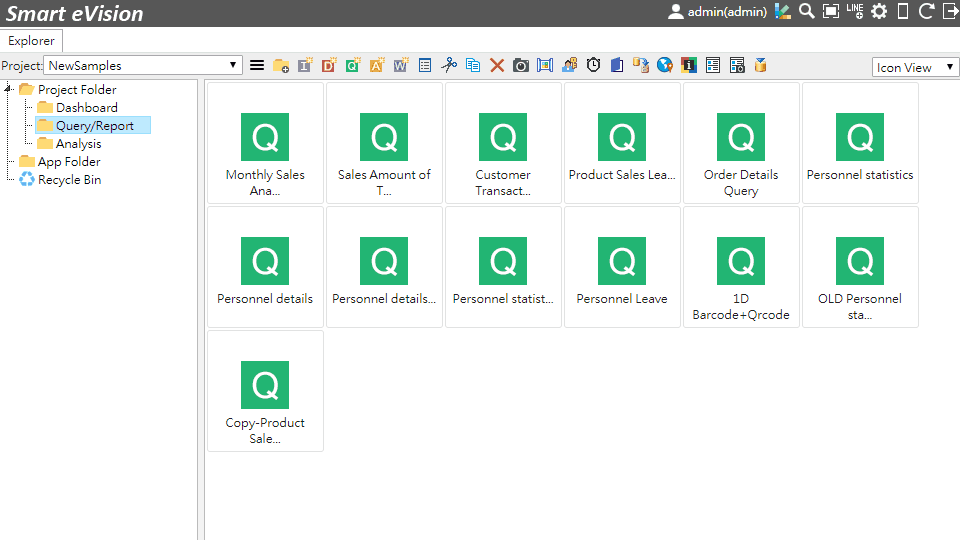
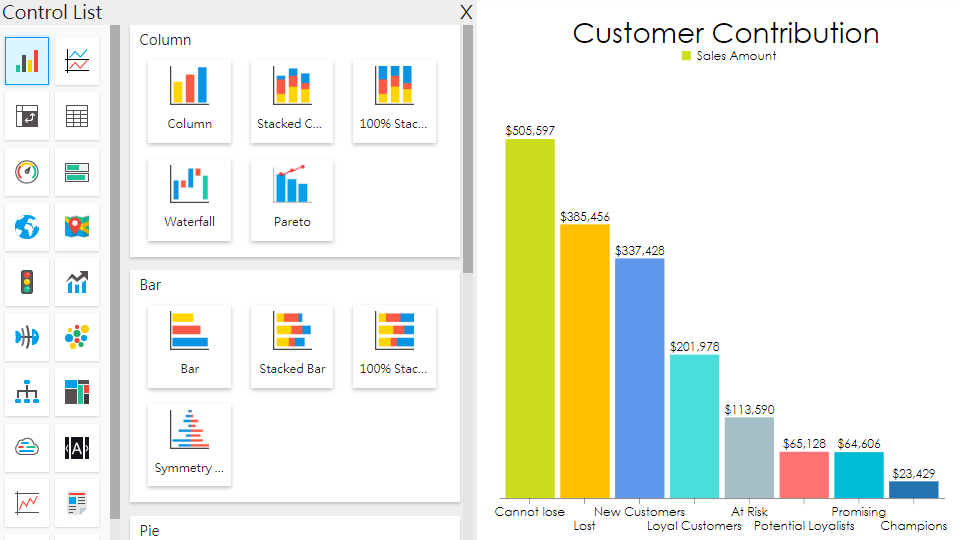
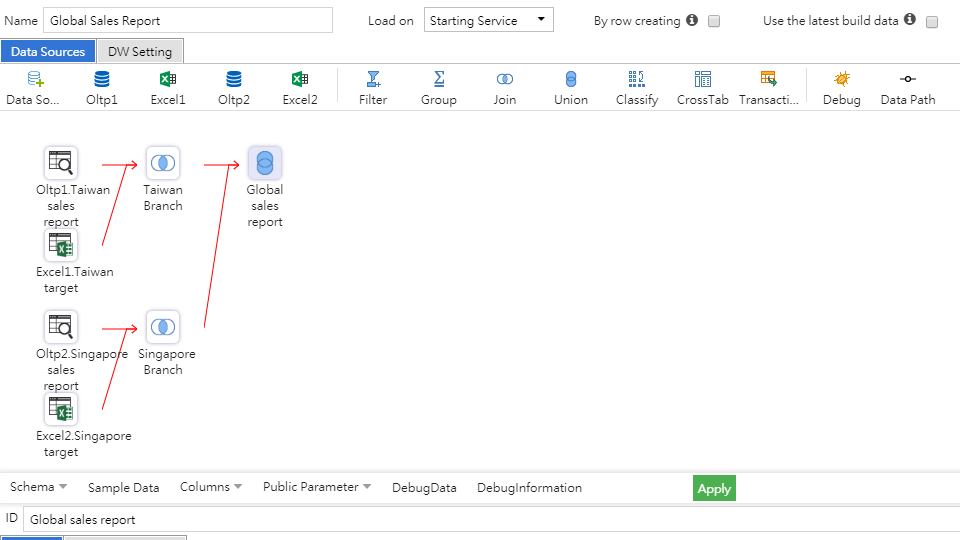
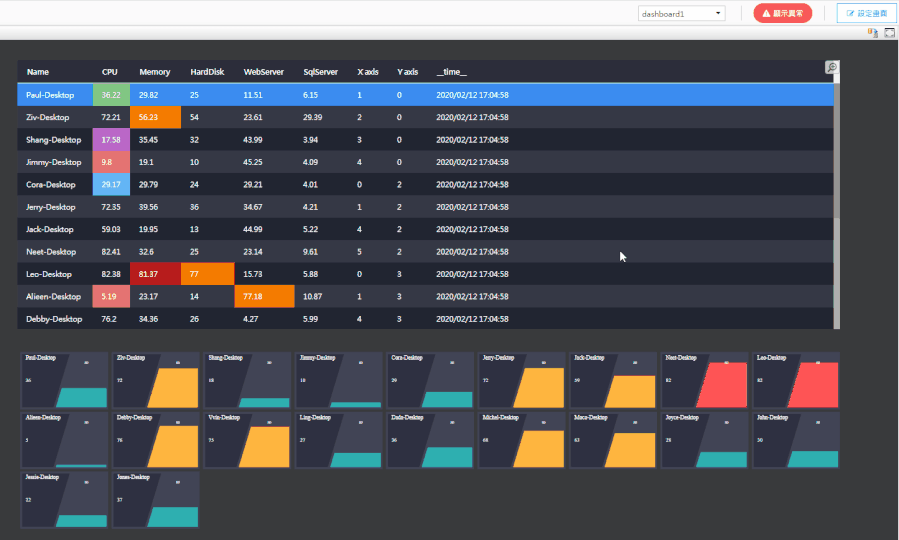
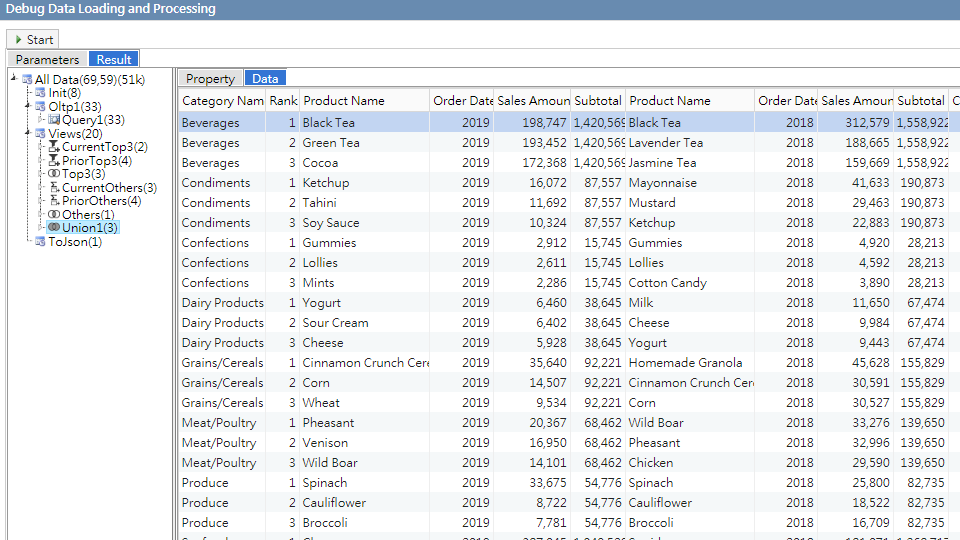
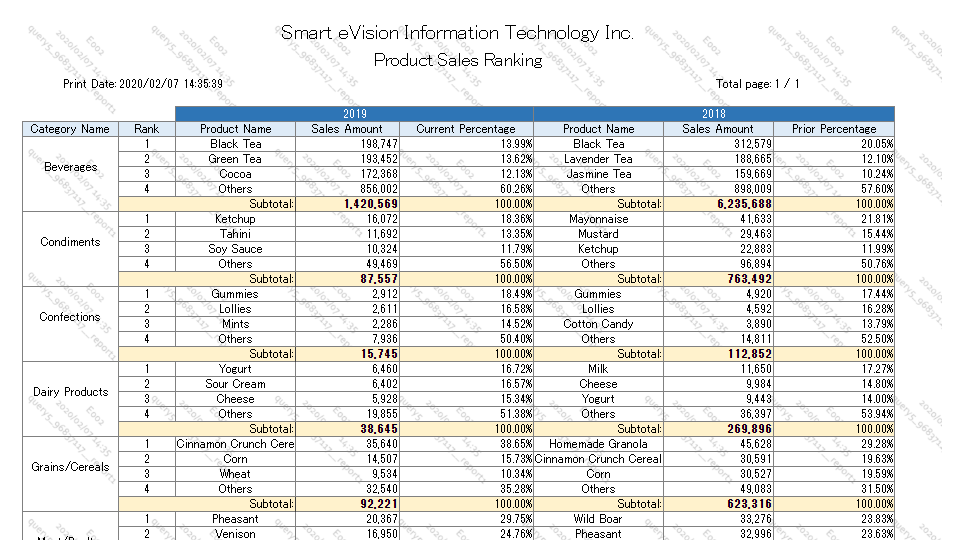
Query/Report
Create complex queries and reports with ease.
-
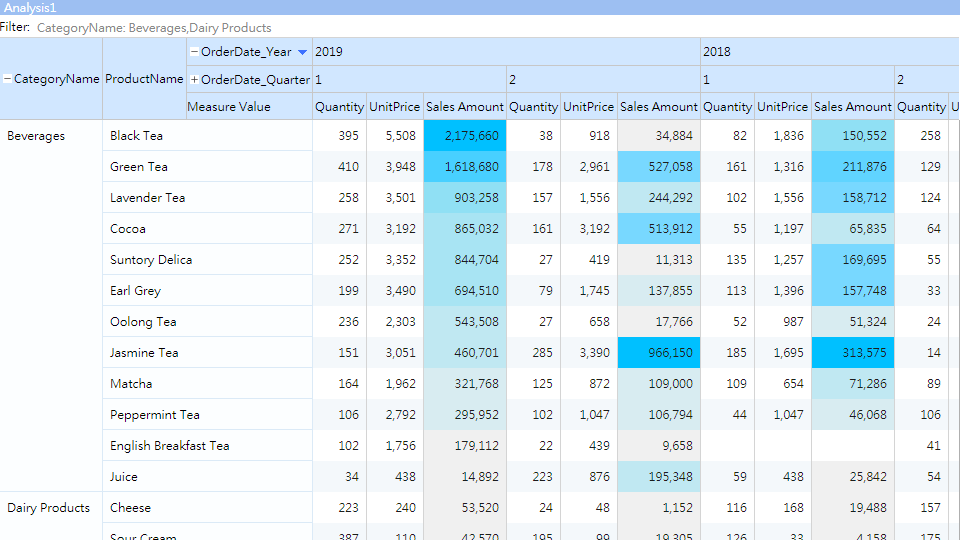
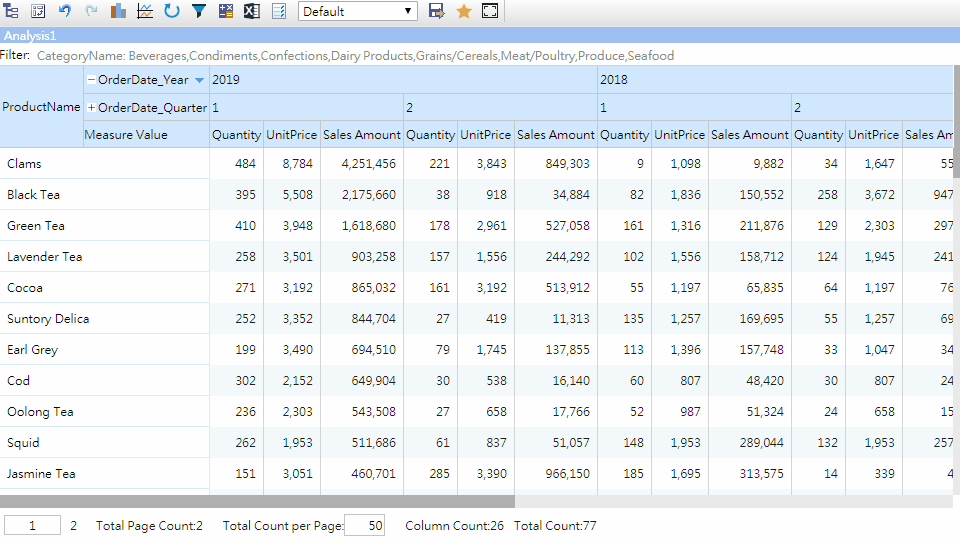
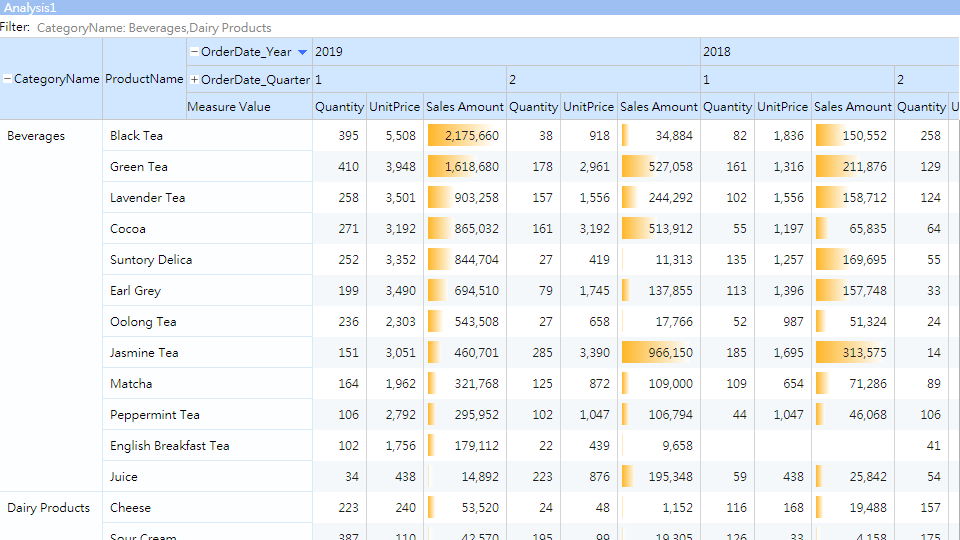
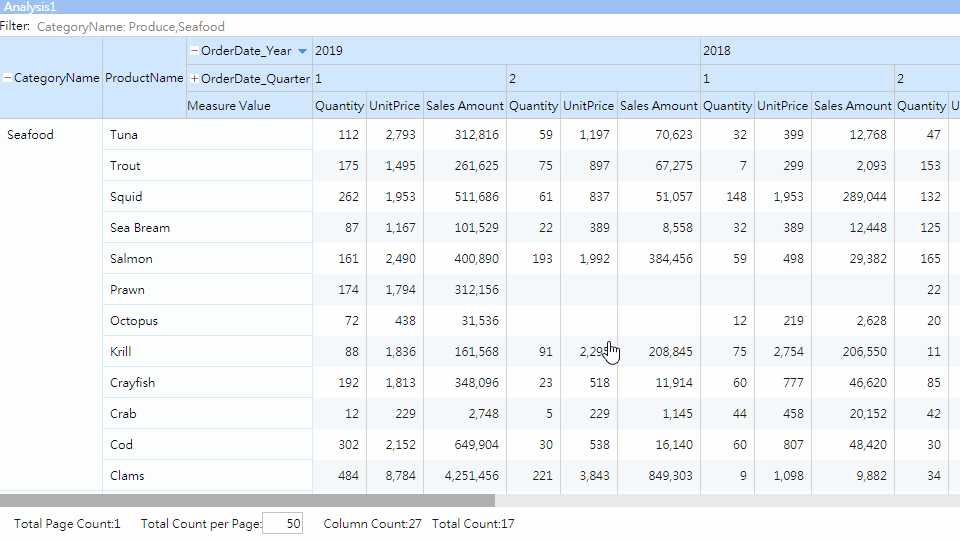
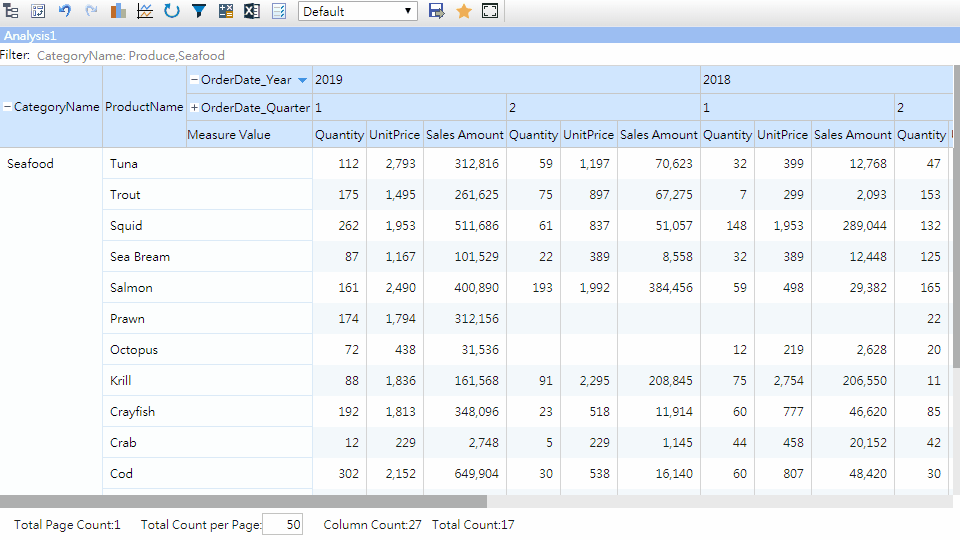
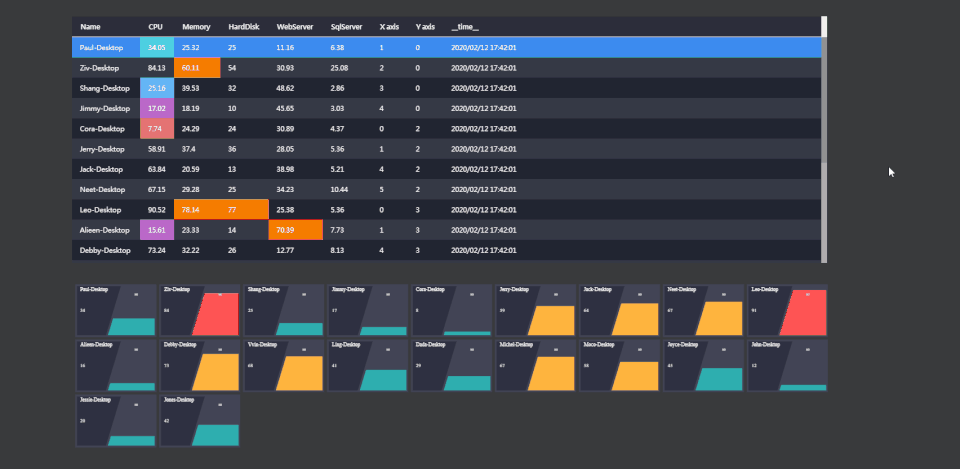
Analysis
Give users a chance to create their own analysis.
-
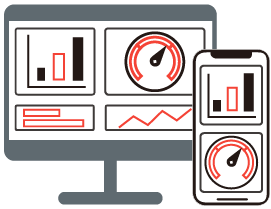
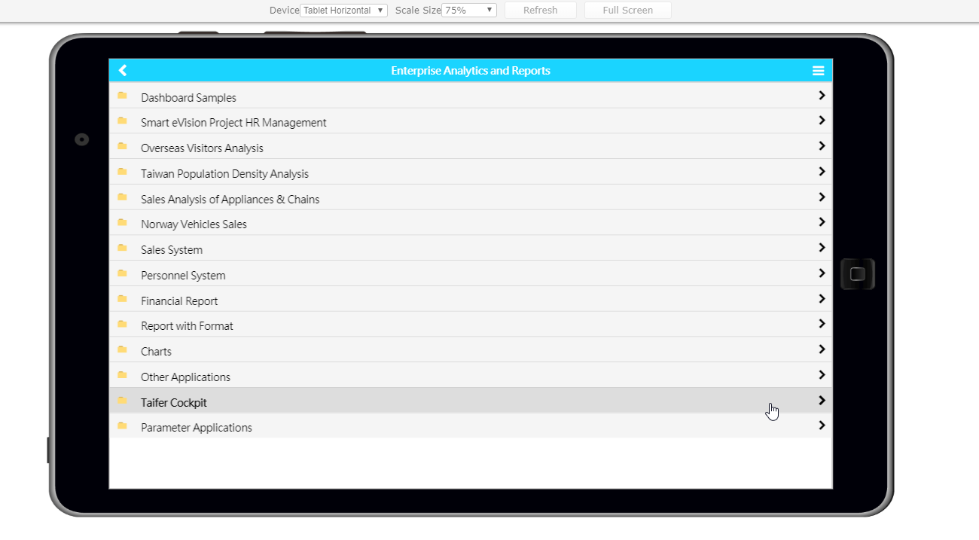
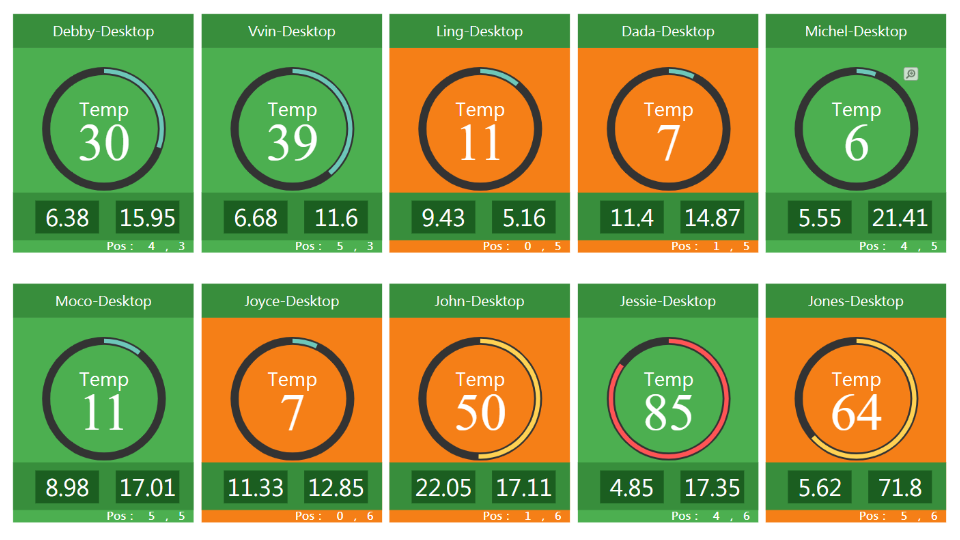
Mobile
Data at your fingertips.
-
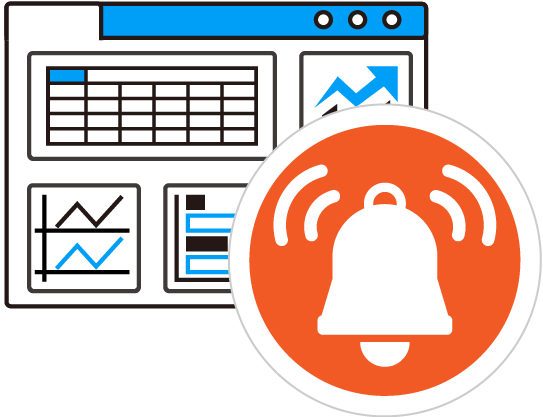
Scheduling
Relieve staff of routine tasks and set mobile alarms.
-
Workflow
Satisfy enterprise flow applications.
Product Lines
Add-on Modules
-
-
Why Smart eVision
-
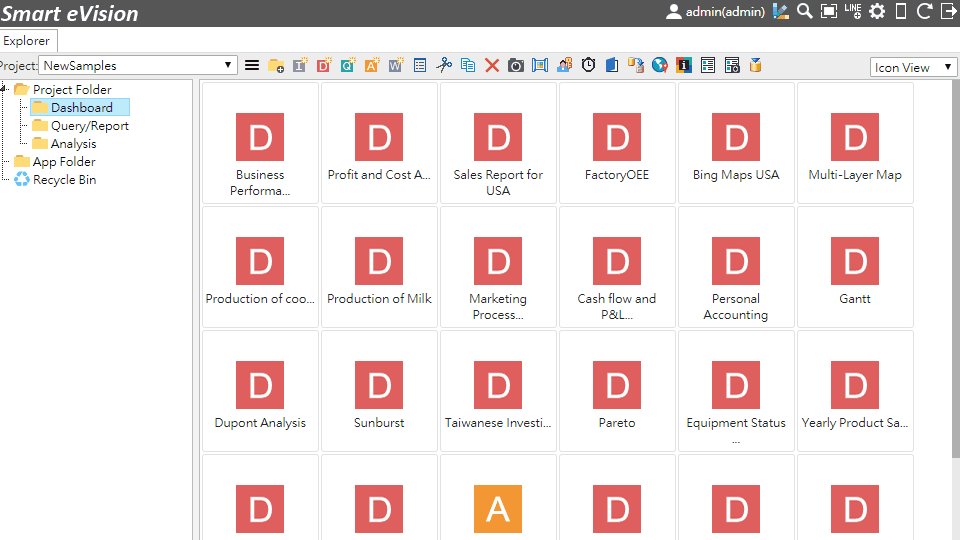
Samples
-
Resources
-
About
Contact us!
Please fill out the form below and we will contact you ASAP.

SmarteVision Cookies usage
This website uses cookies to offer you a better browsing experience. By clicking "I agree" or by continuing to browse, you agree to our privacy policy and cookie policy.


.png)
.svg)


 Embedded BI.png)
 Embedded BI.svg)