Analyze a variety of charts and graphs on a single page. Dashboards help make data analysis and decision-making fast and precise.

Dashboard


Alternate Text
Alternate Text
Alternate Text
Alternate Text
Alternate Text
Alternate Text

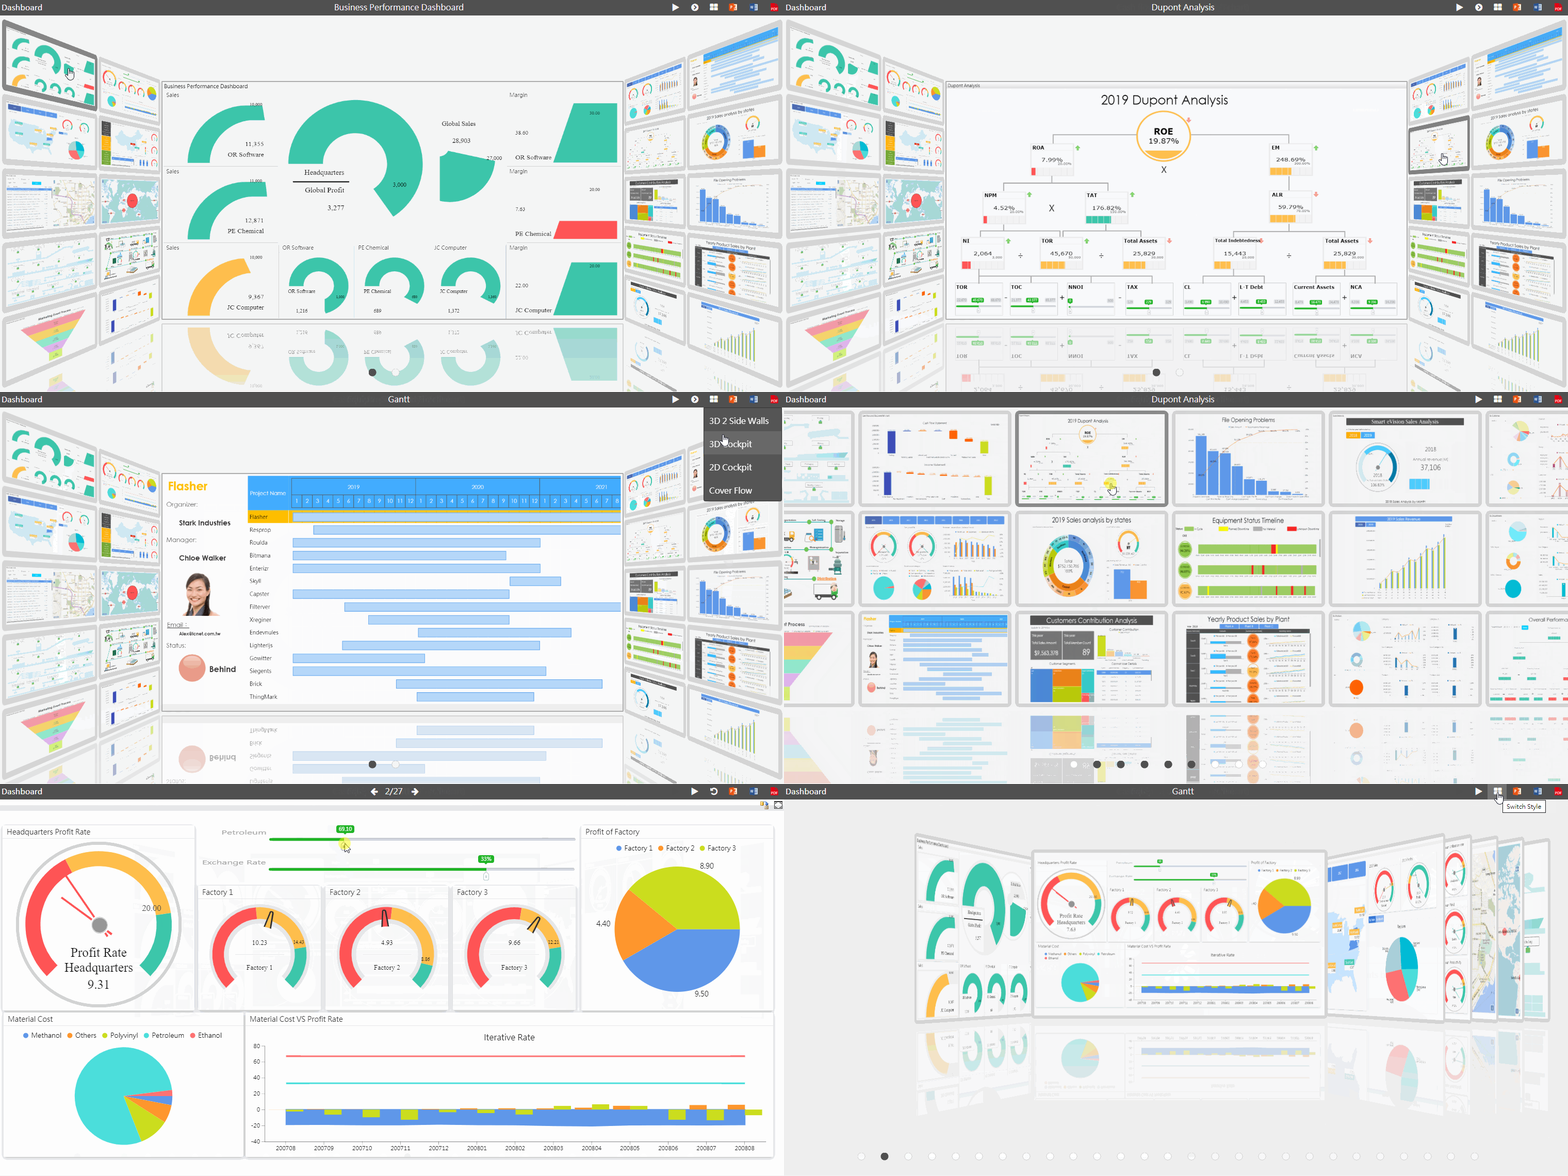
The Cockpit

2D Display, 3D Surrounding, 3D 2-Sided Wall, and Cover Flow.

● The Cockpit is a Dashboard presenter that enhances your data presentation experience. Use the Cockpit for meetings, video wall displays, factory IoT monitors, and more.
● Managers can rapidly examine data from a holistic point of view without having to access reports from different systems.
Multi-monitor display: Display your dashboards on real video walls. It can be applied to settings such as sales combat or the production line.
Looping slideshow: Play Cockpit pages like slides. Suitable for big screens such as factory monitors and information screens / displays.
Export the Cockpit as Word, PDF, or online/offline interactive PowerPoint.

Rich data visualization

Inspire valuable business insights with the most suitable visuals.

● Select from 60+ visuals to represent your data. (e.g. charts, graphs, gauges, buttons, videos, images)
● By organizing raw data into charts and diagrams, information becomes much easier to read and explain.
● Spot problematic numbers instantly with indicators such as colors, arrows, lights, and gauges.
Easy to design: Just drag and drop visuals onto the layout and start inserting data. There are instructions to show you the fields required for each visual.
● When designing the same dashboard for different devices, there is no need to redesign from scratch. All data models and visuals are saved and the only thing you need to do is adjust the layout.

Strong analytical power

Easy steps leading to complex calculations and data analysis.

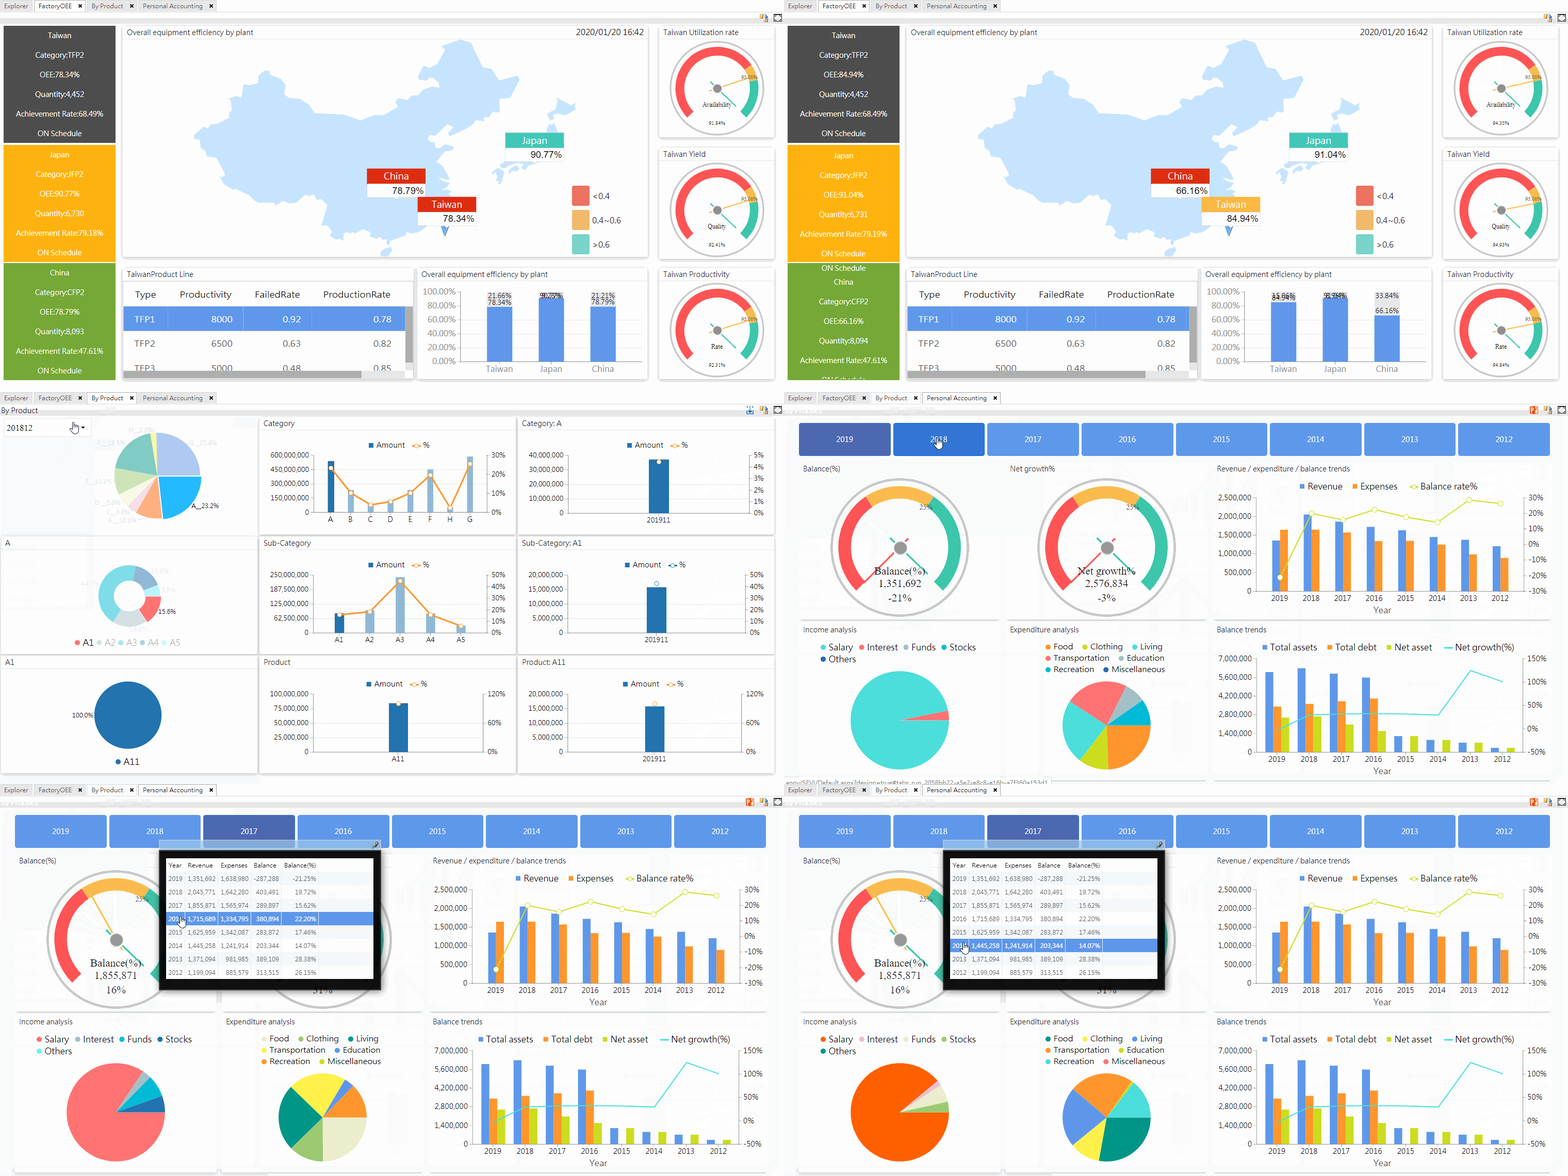
● View and compare various charts and graphs simultaneously.
Heterogeneous data can be analyzed on the same page.
● Create complex calculation fields with very simple steps.
Color Settings: Colors help discover patterns and problems quickly. Tools include indicators, data bars, color scales and icon sets such as arrows and lights, etc.
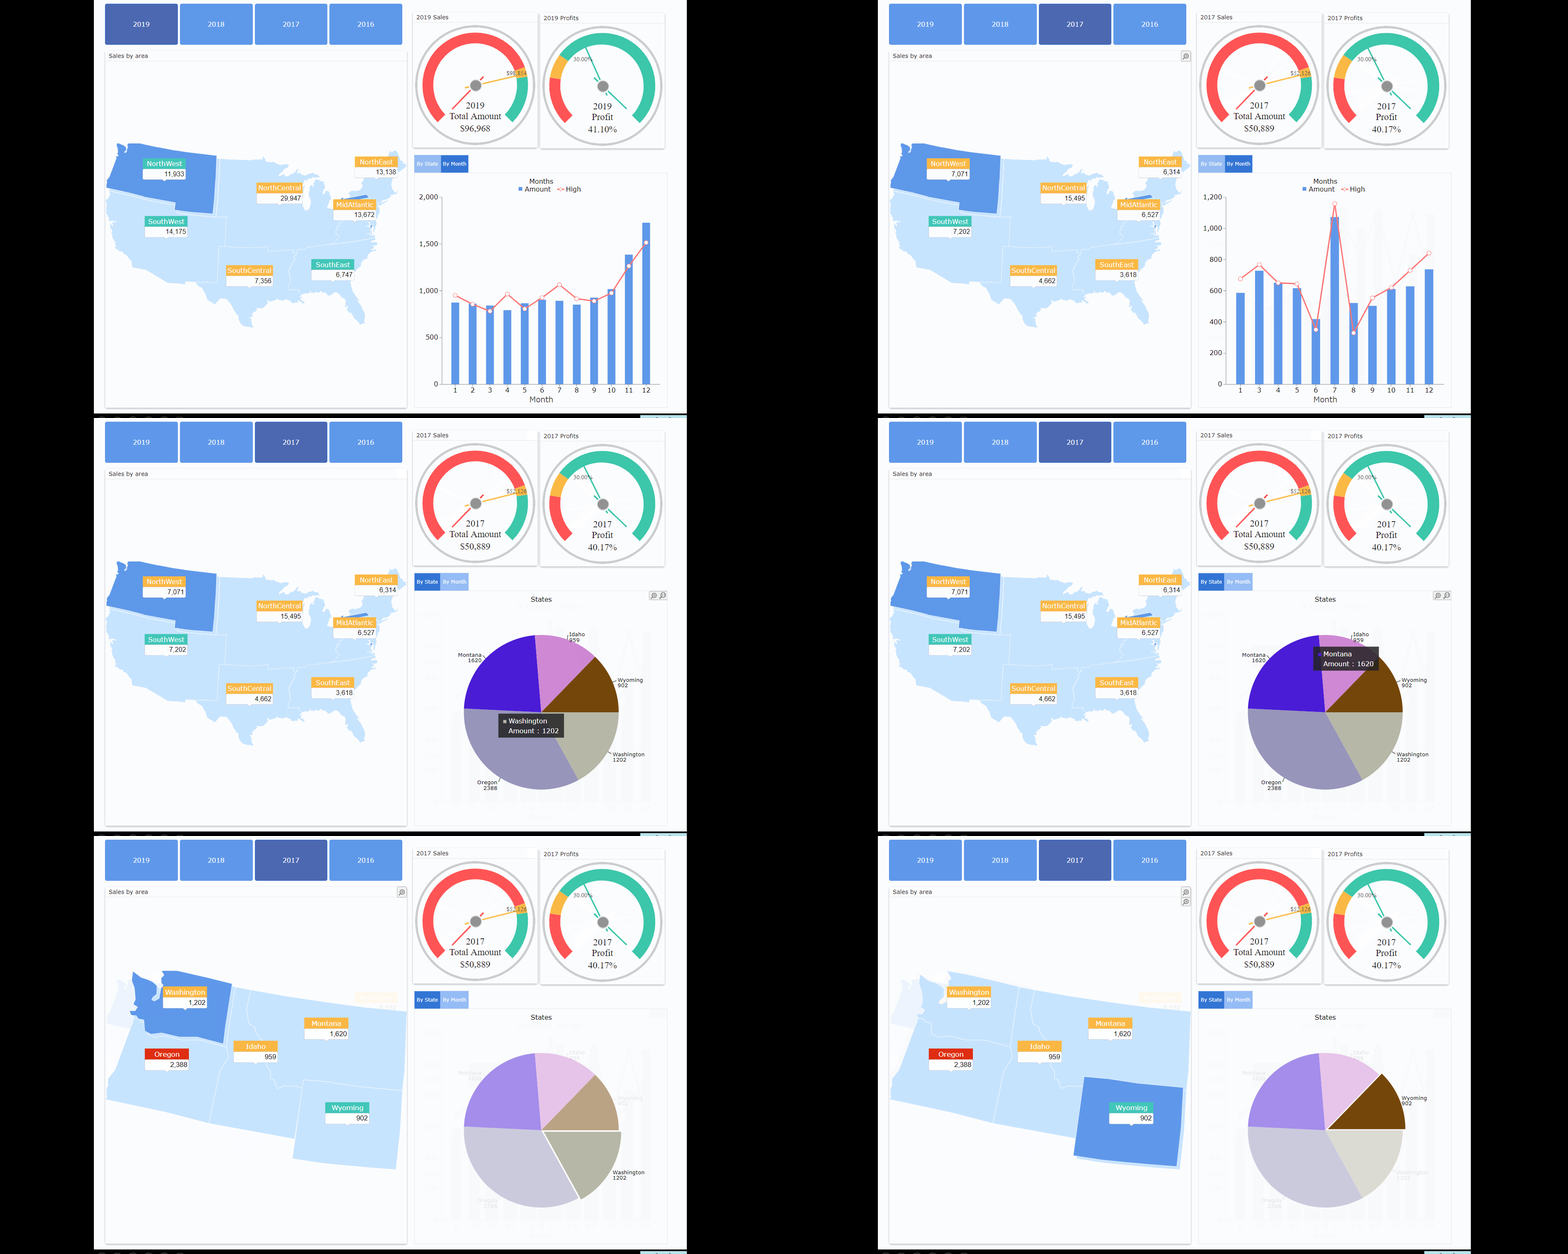
Drill down: Users can drill down to more detailed pages and examine more specific information.
R language prediction is available for statistical analysis, illustrations and data mining.

Dashboard, Strong Analytical Power, Calculation, colors, drill down

Interactive display


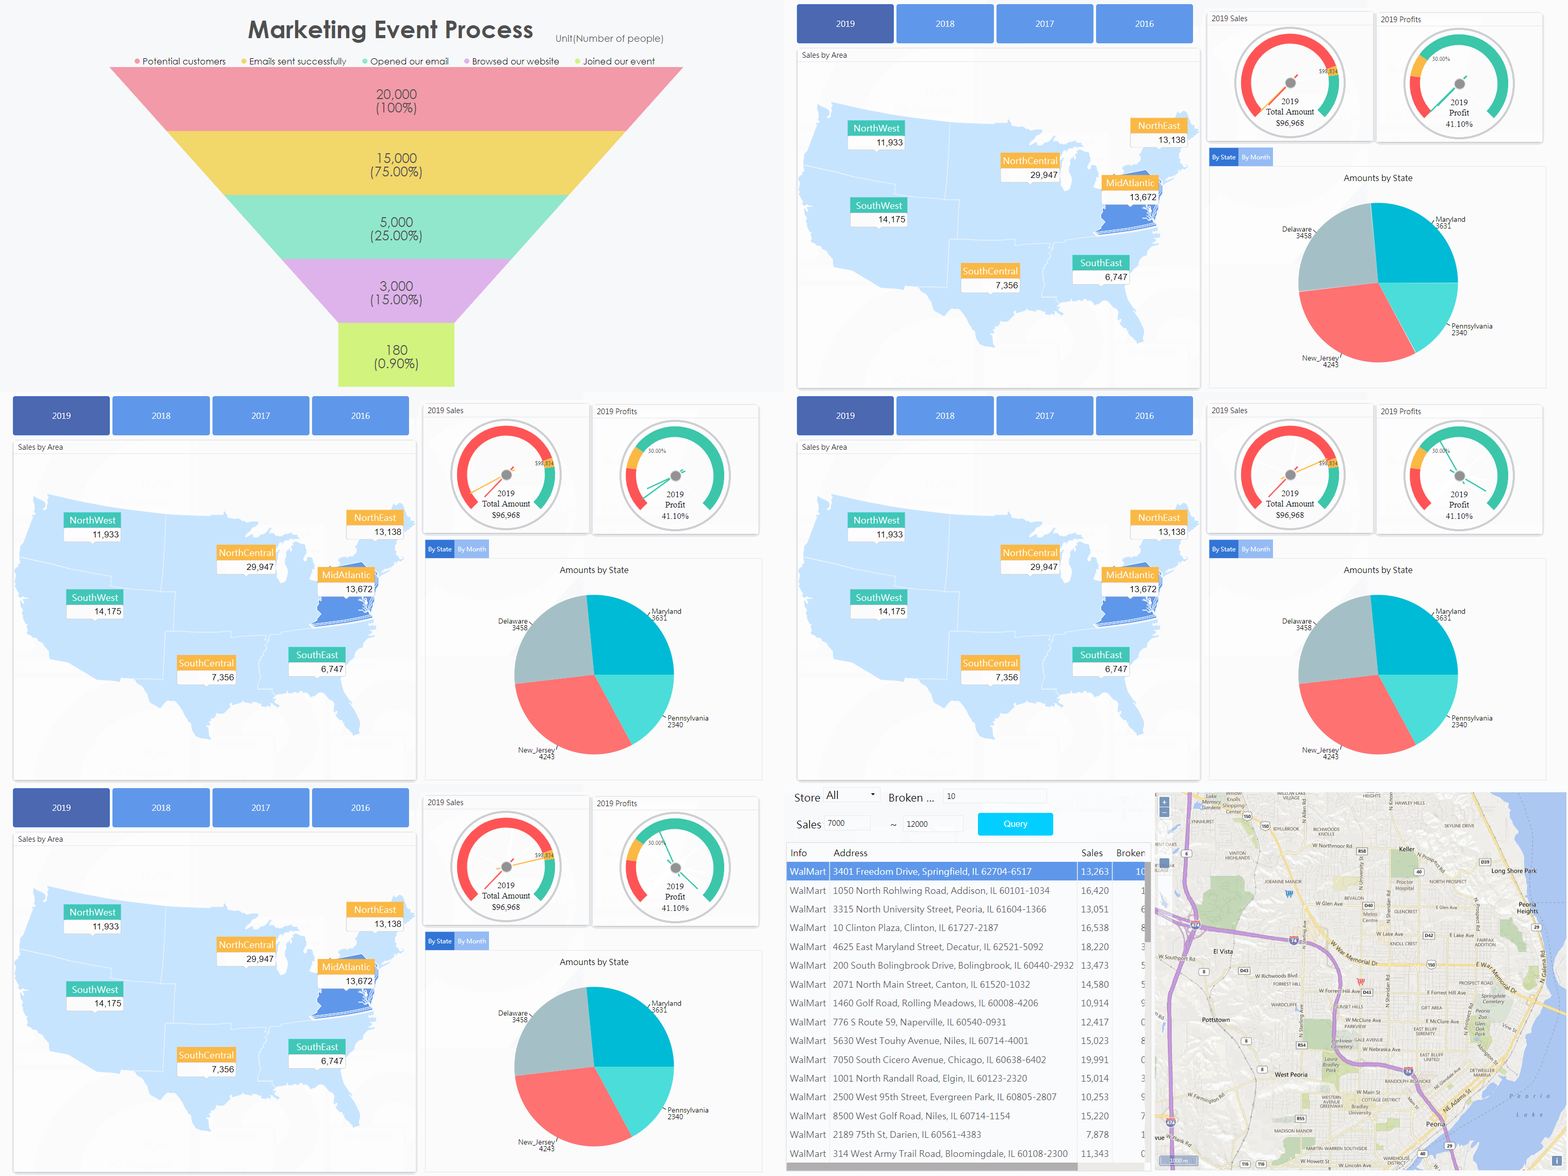
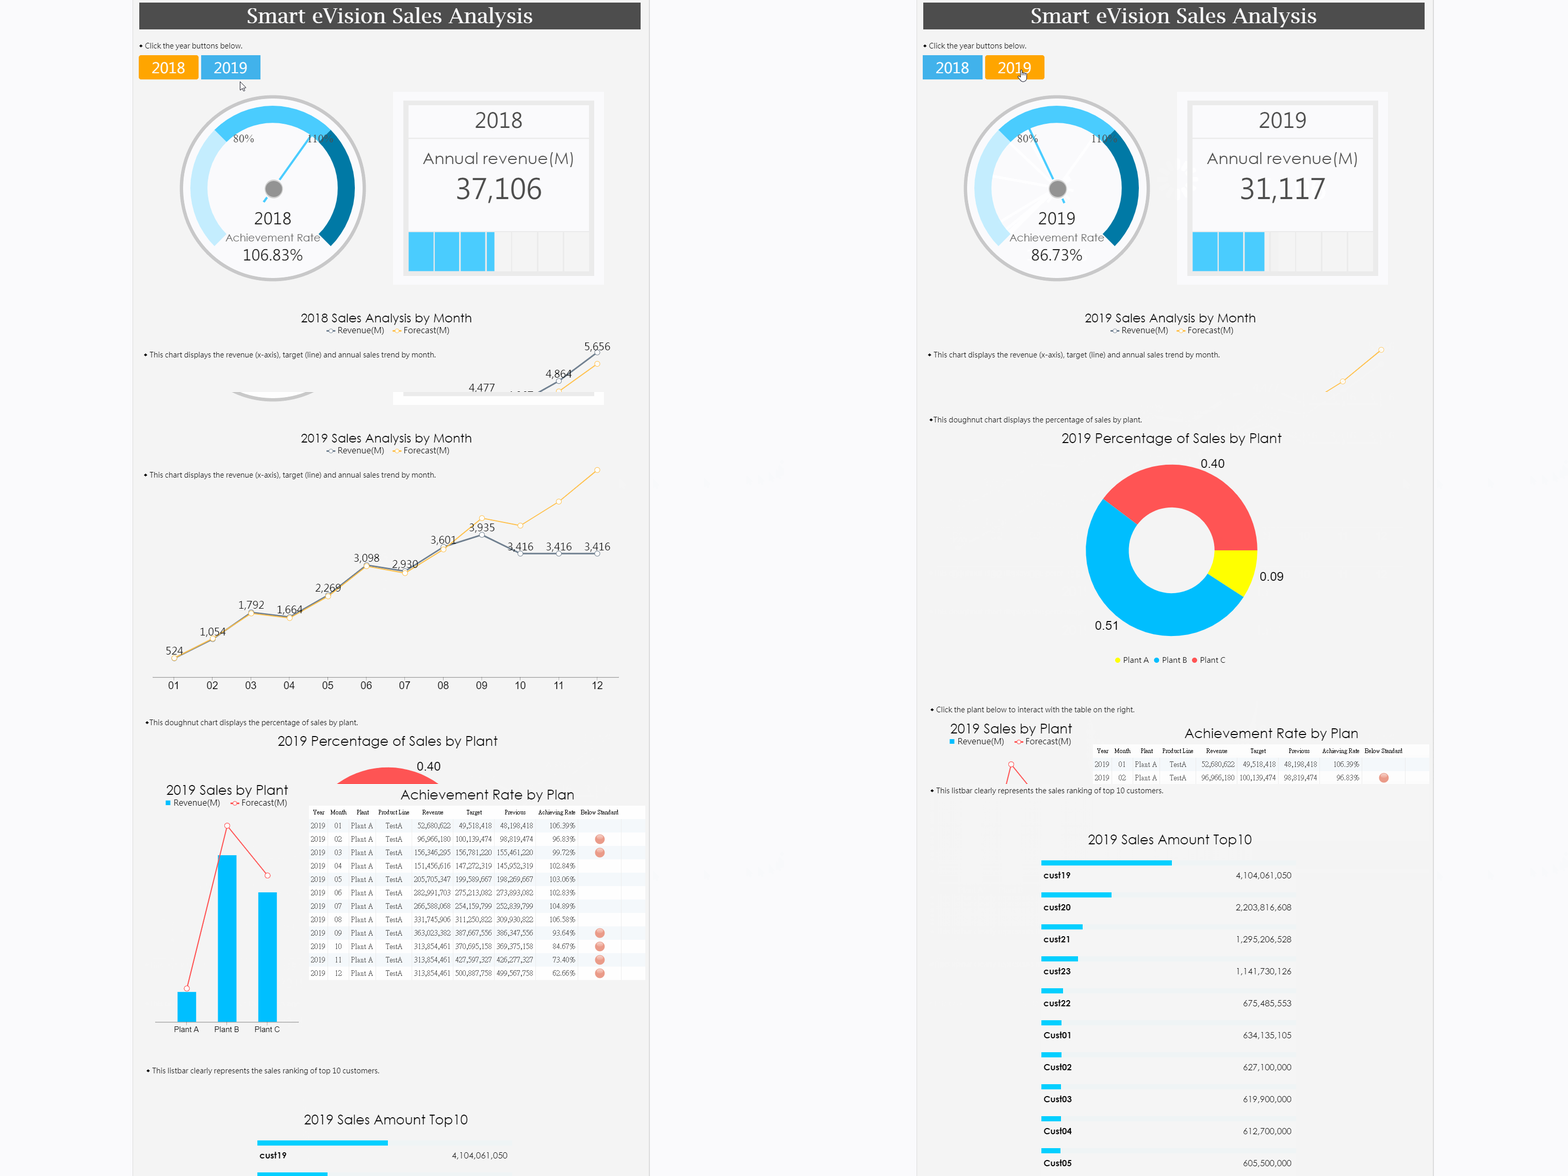
Related visuals can be linked together. When a certain field is selected, other visuals change accordingly.
Expand & collapse grids and charts.
● Don’t let your data be limited by screen size. Hint windows appear when the cursor is hovered above the assigned visual, showing related graphs inside.
Condition filtering: Users can filter selected conditions to their specifications.
Push data: Update data every few seconds or minutes.


Check out these samples

Come interact with our samples!

See visuals in actual use, observe interface designs, try out buttons, maps, conditions and color settings.

Discover what possibilities there are with Smart eVision!


Go to Samples


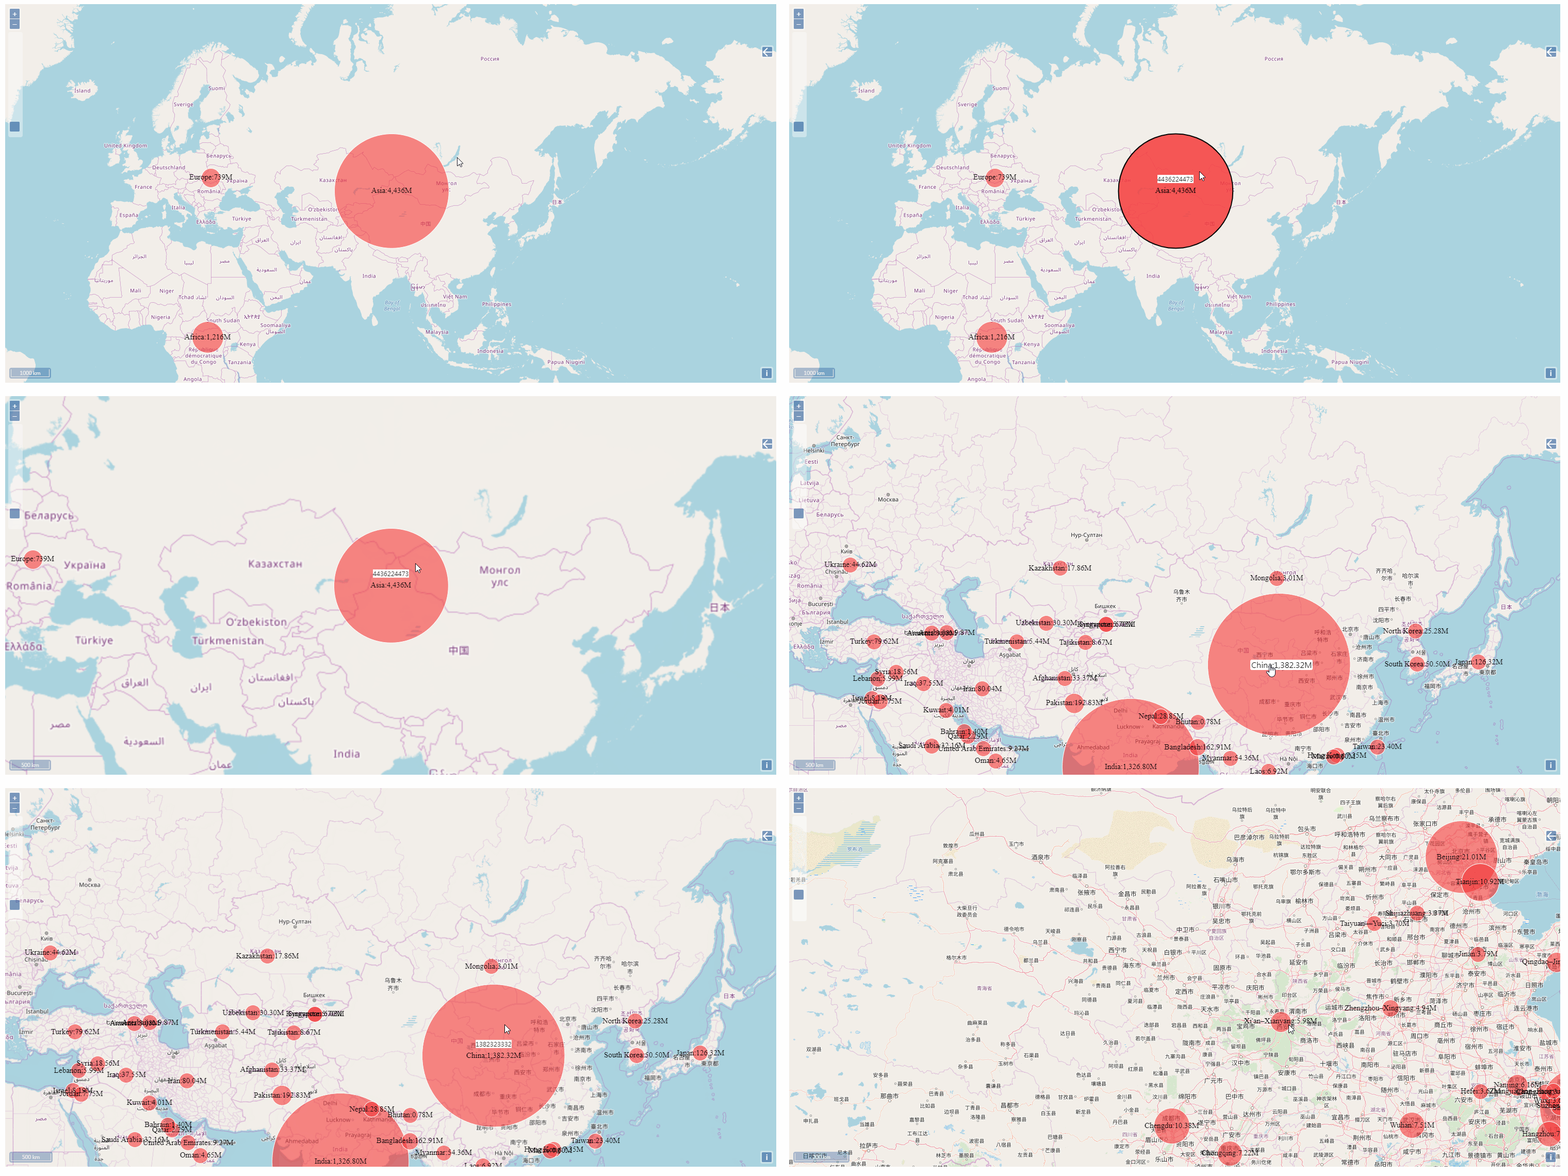
Diverse display of geographical data

● Smart eVision provides vector maps of all continents, countries.
OpenLayers: Designers can import maps from OpenLayers. These are dynamic maps which include OpenStreetMap, Bing Map, and Google Map.
Map Management: Designers can import their own SVG images and define the details of each area.
Insert multiple layers of map data to display detailed information.
● Convert an address into longitudes and latitudes.

Export interactive PowerPoint and other file types


● When needed, pages from dashboards and the Cockpit can be exported as PDF, XML, JPEG, Excel, Word, and interactive PowerPoint.
Interactive PowerPoint: interactions on the exported PPT files work just like the original web version, and it functions both online or offline.
● For security, passwords can be set for identity verification.

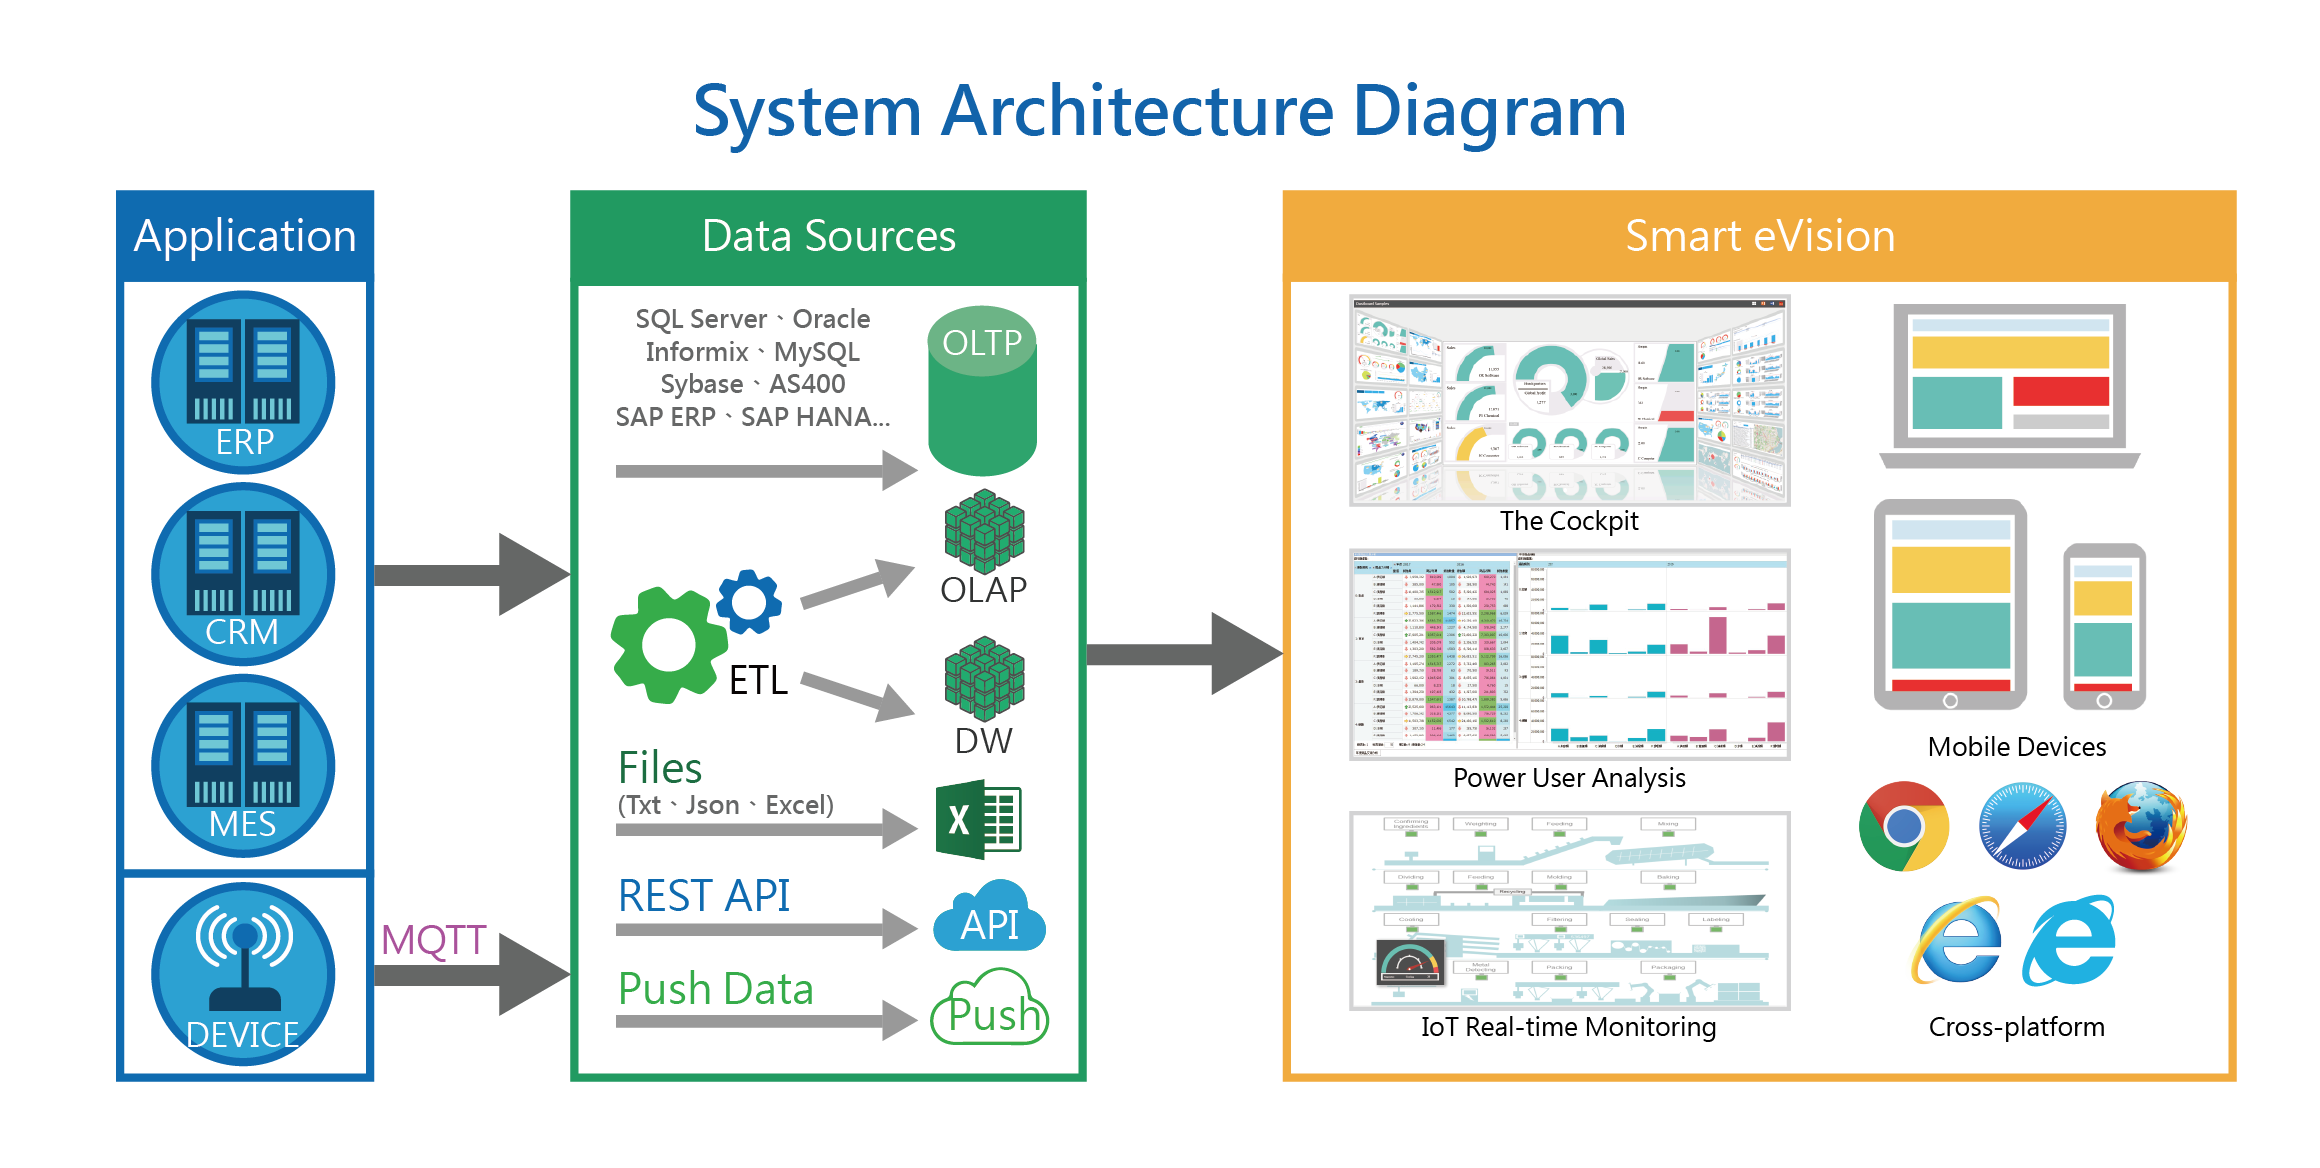
System Architecture


Features of All Products

Export Pages as Different Formats

Dashboard can be exported to Excel, Word, PPT, PDF, XML, PNG.
(Online PPT: Connects back to the server; Offline PPT: Visuals remain interactive)

Authorization Management

Smart eVision provides various authentication and authorization models to meet enterprise requirements.

Learn More
Alternate Text

System Requirements Specification

Server
Hardware Requirements

CPU: Intel Pentium 4, AMD Opteron or later versions

RAM: Above 8G

HDD: Above 160G

(Better equipment, better performance)

(It is recommended to have at least 8G of disk space available.)

Software Requirements

Operating Systems:

Windows 2008 Server, Windows 2012 Server, Windows 2016 Server, Windows 7 Professional, Windows 8, Windows 10

*Microsoft IIS 7.0 or later versions

*Microsoft .NET Framework 4.7.0 & .NET Core 3.0

*Recommend using Google Chrome or Internet Explorer11 or later versions

*Java JDK7 (Install only when using Android AppBuilder)

*Install AccessDatabaseEngine

User Client
Hardware Requirements

CPU: Intel Pentium 4, AMD Opteron or later versions

RAM: Above 1G

HDD: Above 80G

(Better equipment, better performance)

Software Requirements

Operating Systems

Windows 2008 Server, Windows 2012 Server, Windows 7 Professional, Windows 8, Windows 10

**Recommend using Google Chrome or Internet Explorer11 or later versions

*Microsoft PowerPoint 2007 or later versions

Smart eVision文件