Smart開發平台的
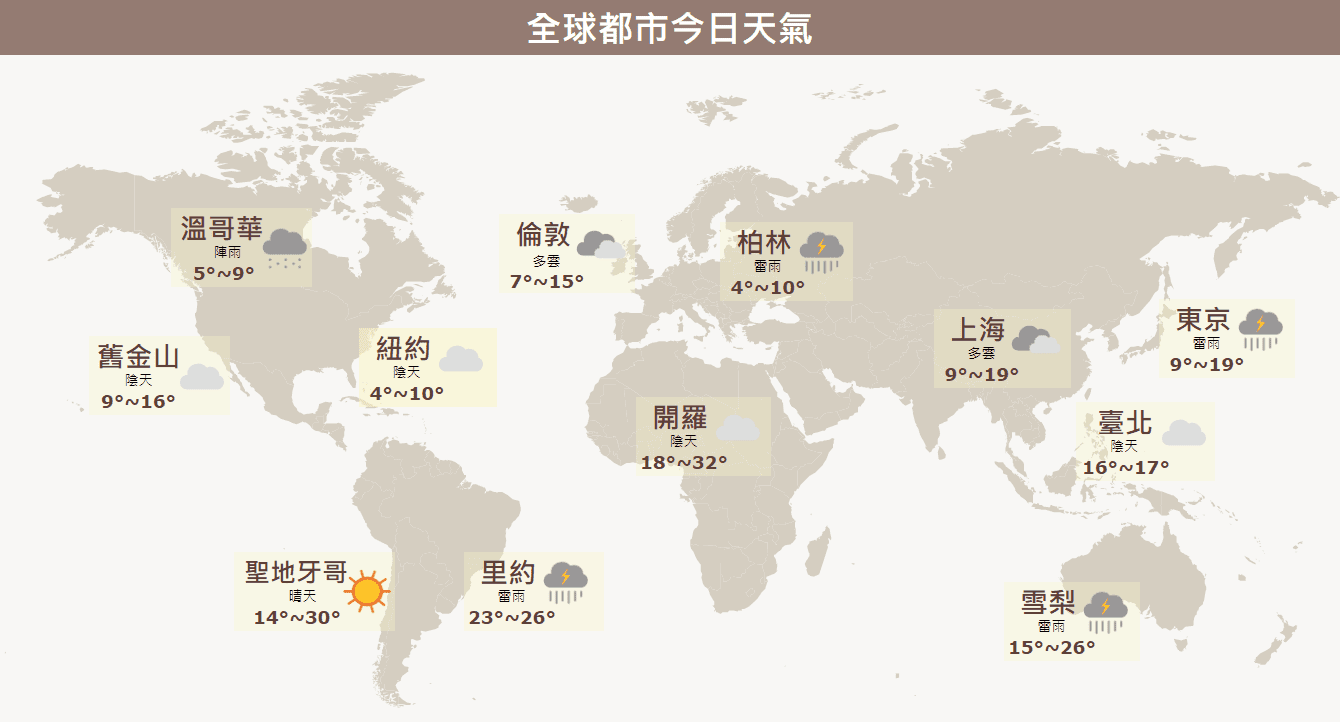
除了從資料庫與Excel、CSV檔案取得資料,也可以使用網路爬蟲取得,下列範例展示全球各城市的當日天氣與溫度,其資料是
取得國際天氣資料的Python語法如下:
#使用爬蟲所需模組
import requests
from bs4 import BeautifulSoup
import pandas as pd

#輸入爬蟲網址,並利用BeautifulSoup解析網頁原始碼
url='https://news.pchome.com.tw/weather/world'
html=requests.get(url)
bs=BeautifulSoup(html.text,'html.parser')

#取得HTML標籤的文字資料
citytemp=[]
citydata=bs.find_all('ul',class_='weather-cell')
for i in citydata:
    cityList = i.find_all('li')
    for j in cityList:
        city=j.find('p',class_='day').text
        weather=j.find('p',class_='temp_s').text[0:2]
        high=j.find('p',class_='temp_s').text[2:5] .replace('/','')
        low=j.find('p',class_='temp_s').text[-3:] .replace('/','')
        citytemp.append([city,weather,high,low])

#將資料寫入資料表
df1=pd.DataFrame(citytemp,columns=['city','weather','high','low'])
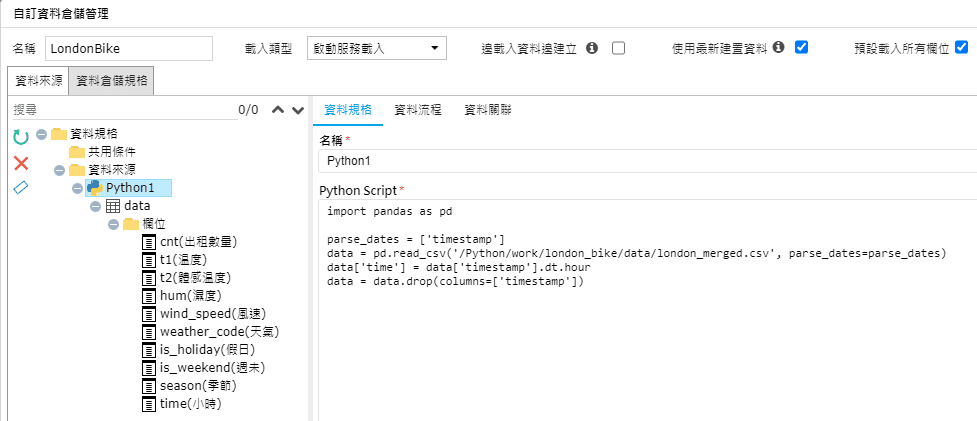
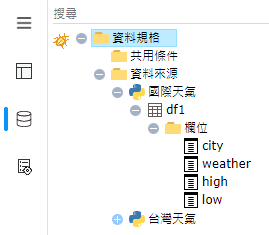
語法輸入後,會依據所設定的欄位名稱建立下圖「資料規格」樹:
Python擁有Seaborn、Plotly等豐富的
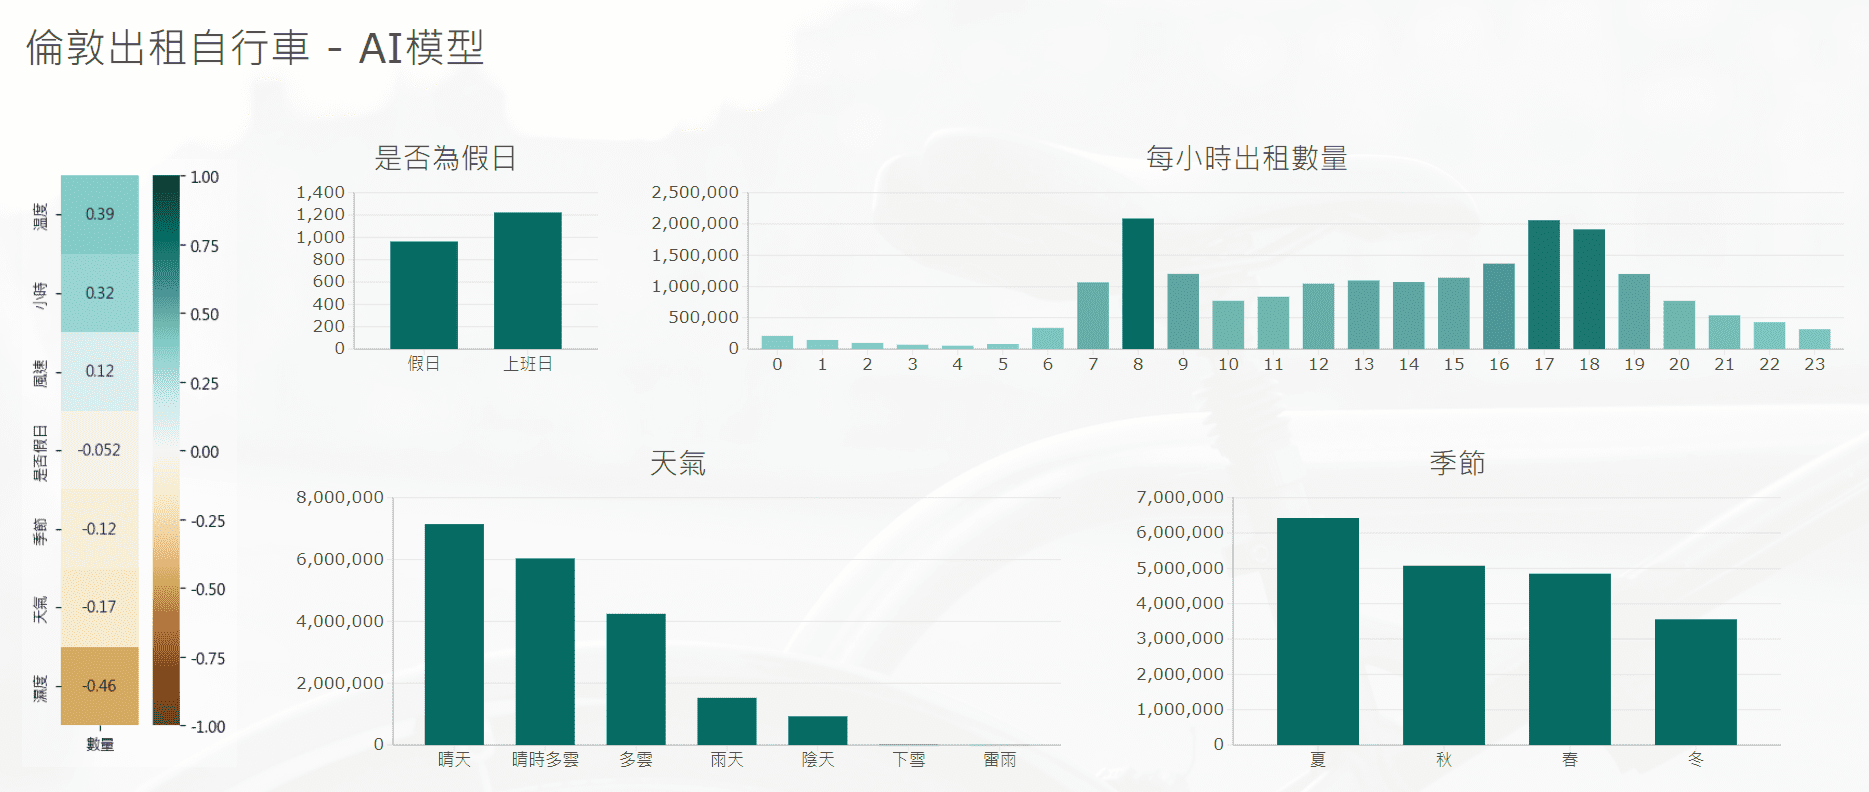
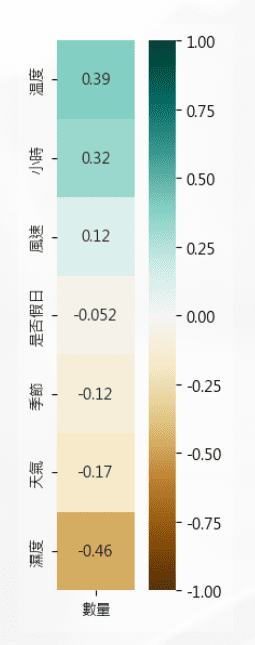
每個方格表示每個環境因素 (濕度、天氣、季節、溫度、時間、是否假日) 與自行車出租數量的相關程度。將下方的語法輸入PythonVisual元件後,即可顯示Python熱力圖。
import pandas as pd
import matplotlib.pyplot as plt
from matplotlib import font_manager
import seaborn as sns

#載入及整理資料
parse_dates = ['timestamp']
df = pd.read_csv('/Python/work/london_bike/data/london_merged2.csv', parse_dates=parse_dates)
df['小時'] = df['timestamp'].dt.hour
df = df.drop(columns=['t2'])
df = df.drop(columns=['timestamp'])
df = df.drop(columns=['is_weekend'])

#計算相關性
df_corr_cnt = df.corr()[["數量"]].sort_values(by="數量", ascending =False).iloc[1: , :]

#繪圖
plt.rcParams['font.sans-serif'] = ['Microsoft JhengHei']
plt.rcParams['axes.unicode_minus'] = False
plt.figure(figsize=(3.2,6.6))
sns.heatmap(df_corr_cnt, annot =True, square=True, cmap = "BrBG", vmin =-1  ,vmax=1)
Python程式語言的一大強項是能夠
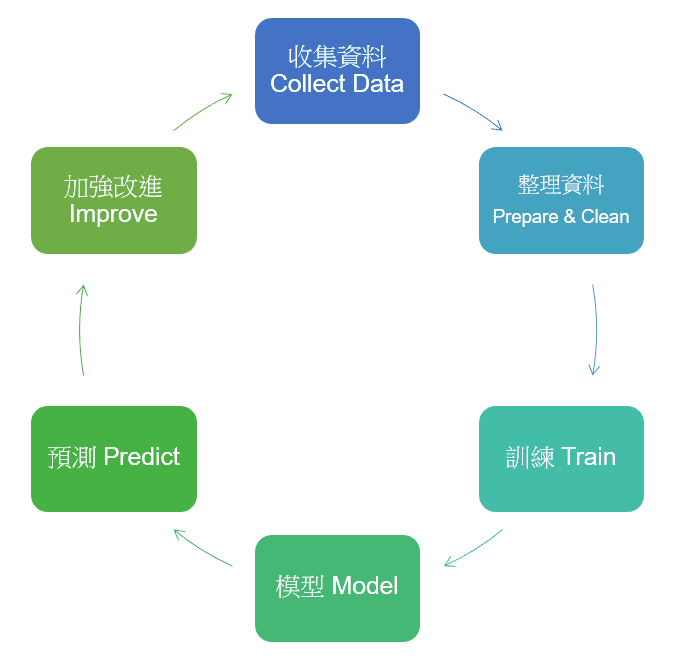
- 1. 收集資料:收集相關資料,用來當作預測的依據
- 2. 整理資料:將收集來的資料進行清洗、整理
- 3. 訓練:將整理完成的資料訓練成模型
- 4. 模型:由所收集的資料經過訓練後,建立成模型
- 5. 預測:運用模型對未來數據的走向進行預測
- 6. 加強改進:預測結果出來後,對於現況進行加強改進
- 最後回到「1. 收集資料」,重複此循環。
舉一個實際例子來帶入上述流程,下圖範例
為了預測未來每日的出租數量,首先必須先收集、整理過去的出租資料,並將整理好的資料訓練成迴歸模型,訓練模型的語法如下圖:
import numpy as np
import pandas as pd
import tensorflow as tf
import autokeras as ak
from sklearn.model_selection import train_test_split

# 載入及整理資料
parse_dates = ['timestamp']
df = pd.read_csv('data/london_merged.csv', parse_dates=parse_dates)
df['time'] = df['timestamp'].dt.hour
df = df.drop(columns=['timestamp'])
# 將資料分為 x:特徵, y:結果
x = df.drop(columns=['cnt'])
y = df['cnt'] / 1000

# 將資料分為訓練用及測試用
x_train, x_test, y_train, y_test = train_test_split(
    x, y, test_size=0.1, random_state=42)

x_train, x_test, y_train, y_test = train_test_split(
    x, y, test_size=0.1, random_state=42)

# 訓練模組,包含轉為數值、正規化、全連線、迴歸
input_node = ak.StructuredDataInput()
output_node = ak.Normalization()(input_node)
output_node = ak.DenseBlock()(output_node)
output_node = ak.RegressionHead()(output_node)

reg = ak.AutoModel(inputs=input_node, outputs=output_node,
                    objective='val_mae', metrics=['mae'],
                    max_trials=20, overwrite=True)
reg.fit(x_train, y_train,
        callbacks=[tf.keras.callbacks.EarlyStopping(patience=5, monitor='val_mae')])

# ------------------------------------------------------------------------------
# 衡量模組
print(reg.evaluate(x_test, y_test))

# ------------------------------------------------------------------------------

predicted = reg.predict(x_test).flatten() * 1000
real = y_test.to_numpy() * 1000

for i in range(10):
    print('Predicted:', predicted[i].round(3))
    print('Real:', real[i].round(0))
    print('')

# ------------------------------------------------------------------------------

from sklearn.metrics import r2_score
print(r2_score(y_test, predicted).round(3))

# ------------------------------------------------------------------------------
#輸出模組
model = reg.export_model()
model.summary()

# ------------------------------------------------------------------------------
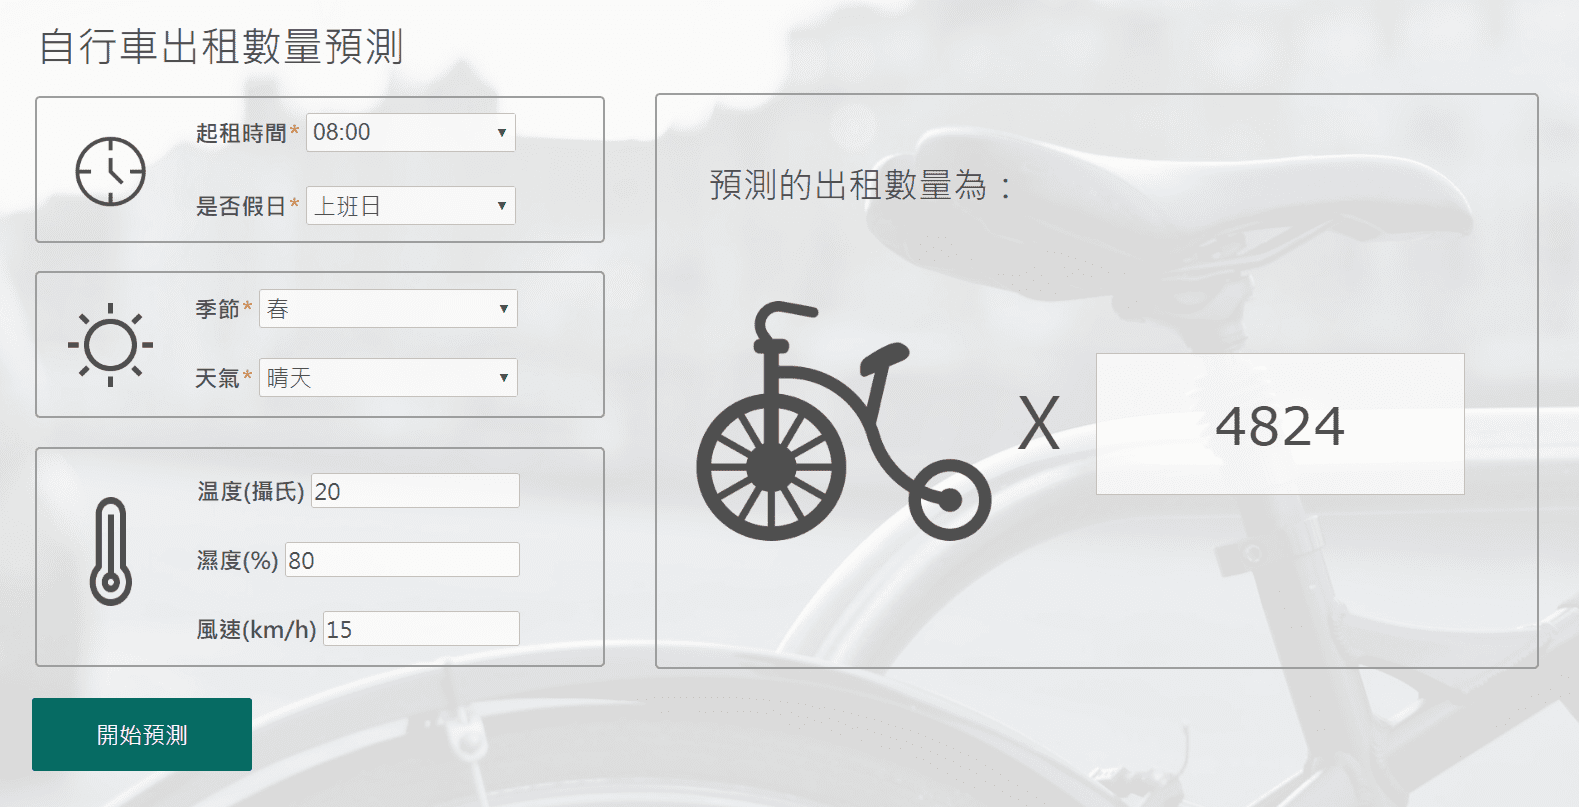
模型建立好之後即可進行預測,此範例的預測動作設計於「開始預測」按鈕的Action Flow中,設計流程如下圖,其中「Python預測」的節點是使用
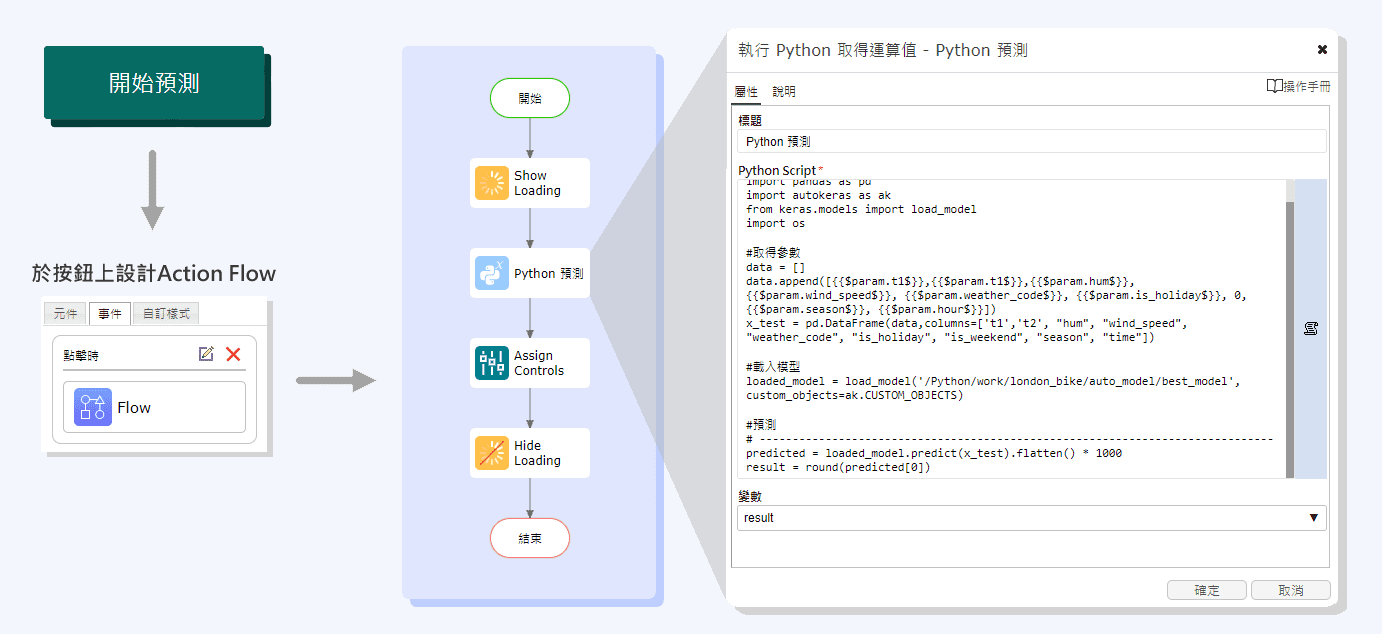
以下語法為圖8中的Python語法完整版:
from pandas import DataFrame
import pandas as pd
import autokeras as ak
from keras.models import load_model
import os

#取得參數
data = []
data.append([{{$param.t1$}},{{$param.t1$}},{{$param.hum$}}, {{$param.wind_speed$}}, {{$param.weather_code$}}, {{$param.is_holiday$}}, 0, {{$param.season$}}, {{$param.hour$}}])
x_test = pd.DataFrame(data,columns=['t1','t2', "hum", "wind_speed", "weather_code", "is_holiday", "is_weekend", "season", "time"])

#載入模型
loaded_model = load_model('/Python/work/london_bike/auto_model/best_model', custom_objects=ak.CUSTOM_OBJECTS)

#預測
# ------------------------------------------------------------------------------
predicted = loaded_model.predict(x_test).flatten() * 1000
result = round(predicted[0])
得到預測的結果後,便可依據此結果對於每日所提供的自行車數量進行調整,並檢視實際出租數量是否與預測數量相近,然後持續收集資料,重複AI機器學習的循環。
此篇分類於: